Introduction
As game developers, technical artists, and 3D enthusiasts, we often get swept up in the excitement surrounding cutting-edge features like Nanite in Unreal Engine 5. Epic’s demos and promotional materials promise a future where we can throw unprecedented detail into our scenes, skipping over many of the traditional bottlenecks that have constrained pipelines for years.
But here’s the truth: most of us are not working on bleeding-edge machines, nor do we have infinite budgets or RTX 4090s at our desks. That raises a crucial question: What can Nanite do on mid-range hardware today?
This blog series began as a personal investigation. I wanted to understand how Nanite behaves, not in an idealized demo, but on my own workstation — an AMD Ryzen 7 1700 CPU, Radeon RX 580 GPU, and 16GB of RAM. I wanted to know:
- Can Nanite deliver meaningful gains in real-world workflows?
- How does it compare to traditional LOD pipelines when working with high-detail assets?
- Are the promises of “no LOD setup” and “near-infinite triangles” realistic?
- What are the limits — and where do things start to break?
These are the questions I set out to explore. Along the way, I faced system crashes, learned new tool workflows, and uncovered performance quirks I hadn’t expected. This post aims to document the journey, not as a polished success story, but as a real-world snapshot of what it’s like to explore next-gen features on average hardware.
Let’s dig in.
Source (1) https://dev.epicgames.com/documentation/en-us/unreal-engine/Nanite-virtualized-geometry-in-unreal-engine
In this document I would like to introduce you to Nanite and its benefits and problems.
- First, we will set up a Nanite mesh
- Visualise the mesh in the Nanite preview
- Compare Nanite to a traditional LOD method
- Use trace and examine using unreal insight to find the timing of rendering a Nanite mesh vs LOD.
Next Step:
- Test out experimental features.
- Improve a scene using the tools we learned to optimise a nanite scene.
Setup and Process
Test Information
- Project Name: NaniteSkeletal
- UE Version: 5.5
- CPU: AMD Ryzen 7 1700 (8-core, 16 threads, ~3.0 GHz)
- GPU: AMD Radeon RX 580 (8 GB VRAM)
- RAM: 16 GB
- Storage: Limited free space (~6–7 GB available)
- OS: Windows 10 Home 64-bit (Build 19045)
- DirectX Version: DirectX 12
- Model Tested: Wooden_Table_uc1kebzfa_Raw.fbx, ~15MB on disk, 4096 duplicated instances
- Asset Source: Megascans + local import with texture set
- Engine Settings: sg.ResolutionQuality 100, r.ScreenPercentage 100 (forced full resolution), Epic scalability
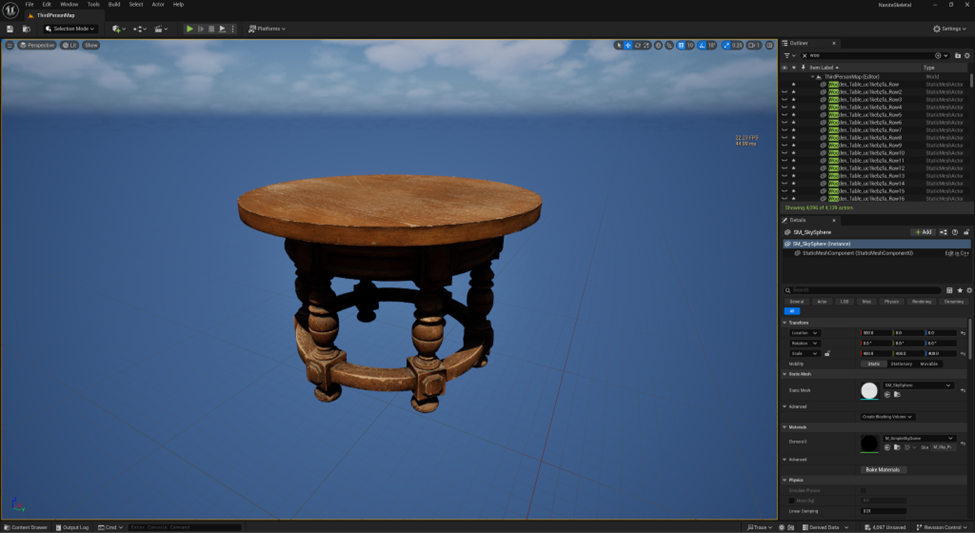
- Lighting: We will keep lighting on for this test to see the quality of the assets.
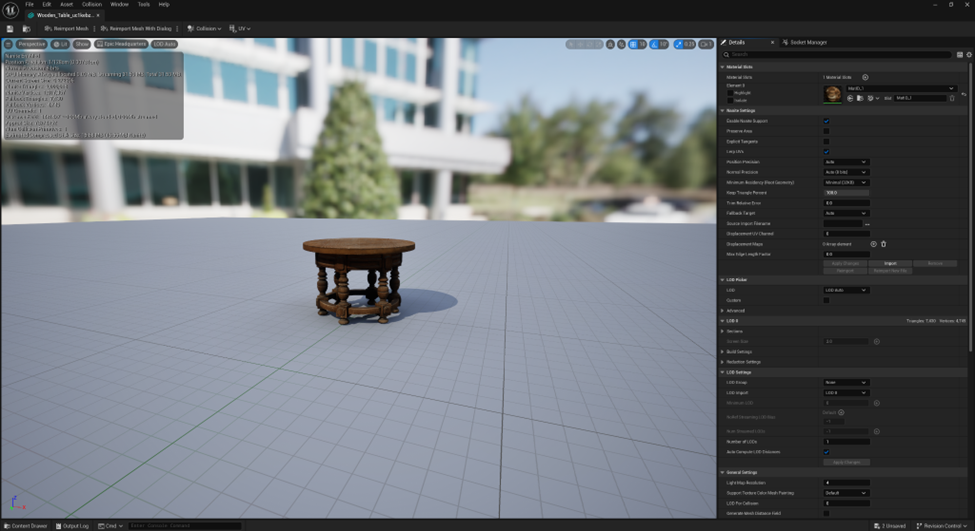
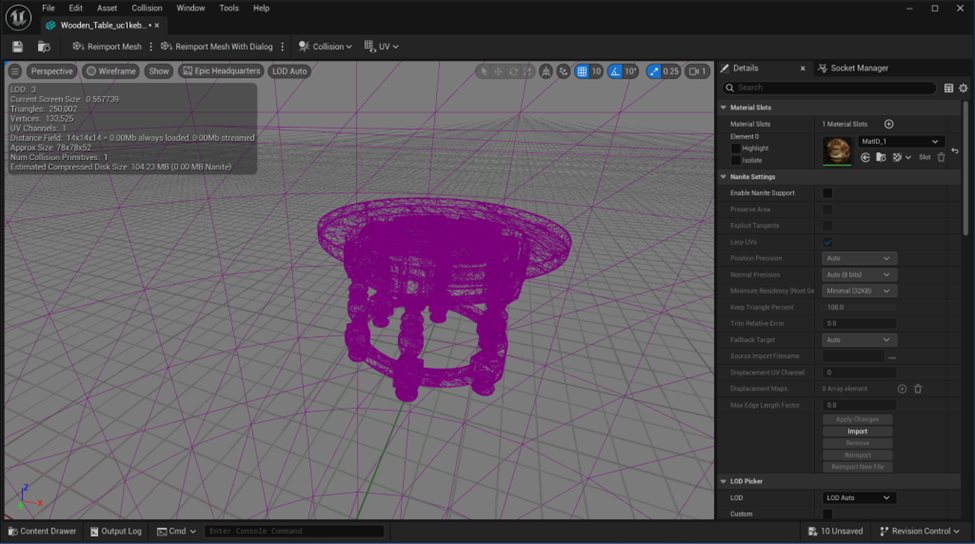
To ensure Nanite was working, I set up a clean scene in UE5.5, imported a test mesh, and confirmed Nanite was active — thankfully, it’s automatically enabled on import. I then ran benchmark tests on the raw ~250,000-polygon mesh to assess performance on my hardware.
Note on test subject:
It was chosen because it is freely available, it’s an inconvenient shape and can tile, Has enough polygons to stress test the system and an item that has the size to occur frequently and is a model that is not a hero asset that you would want to manually Optimize.
Asset: Megascans Table asset Table asset: https://fab.com/s/faa8872c30f4
Performance Observations
- FPS before placing any mesh: ~23 FPS
- FPS after placing 1 mesh: ~21 FPS
- FPS after duplicating 2048 meshes: ~20 FPS
- FPS after duplicating 4096 meshes with full textures: ~17-18 FPS
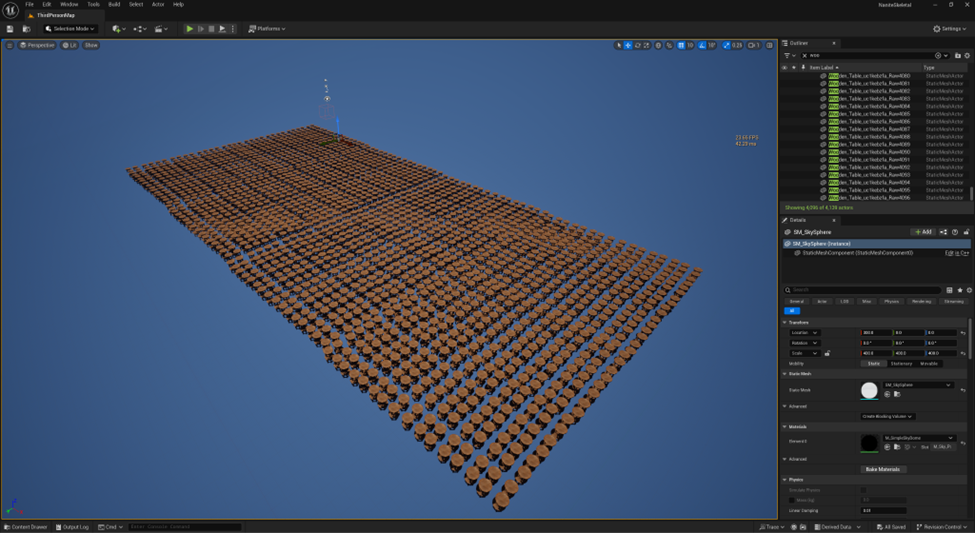
- FPS after pulling away from the camera~ 21 FPS
- GPU Nanite timing: ~4.6 ms on GPU for Nanite when geometry fills large screen space
- CPU/GPU balance: Trace shows more GPU-side cost increase as screen coverage rises
- Were there any instances of stuttering, freezing, or crashes? Stable (but previous tests crashed when RAM was exceeded)
- RAM or VRAM usage spikes? High but manageable on RX 580; no crash observed at 4096 instances
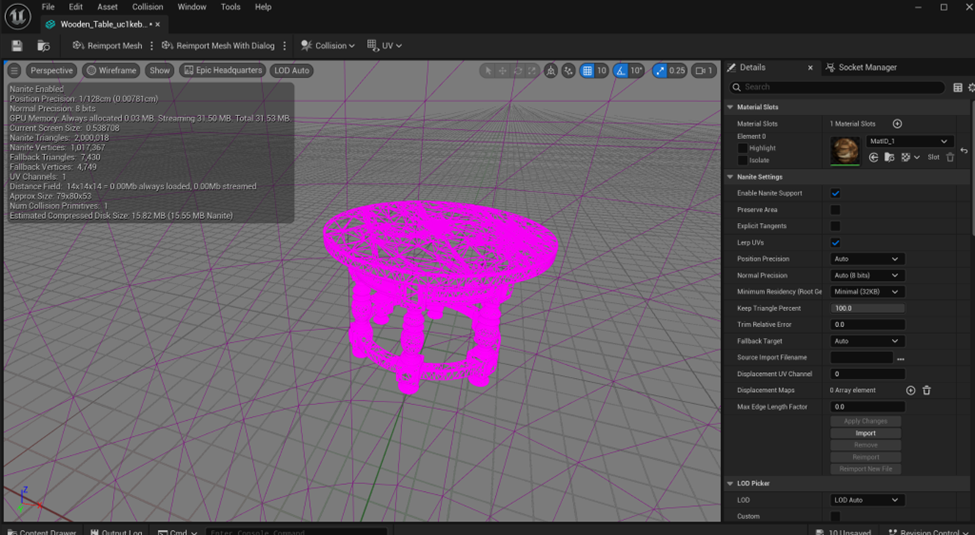
Nanite mesh Fallback 7,430 triangles
Nanite visualizations
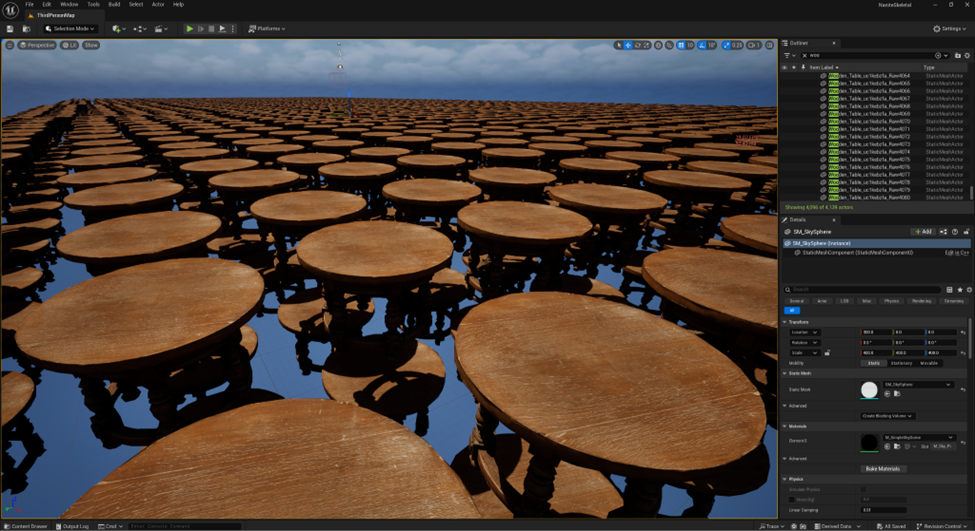
Testing shows Nanite working so it’s time to duplicate the mesh as many times as possible.
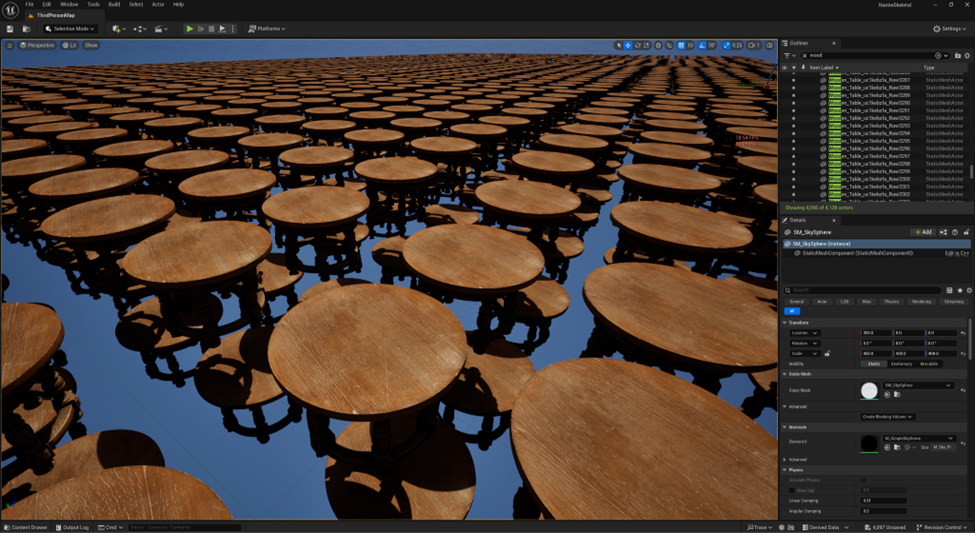
For this test I chose a model that could be tiled with the least amount of wasted space but complex enough to represent a usual use case.
Visualising the issues:
Now that we have our stress test ready, we can look at the visualisations that will help us decide If, where, and what is going wrong in the scene.
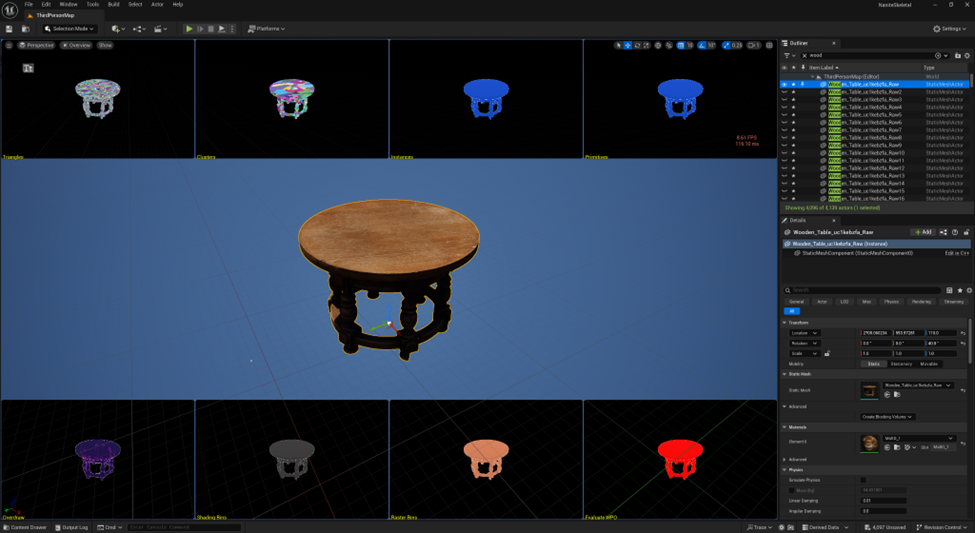
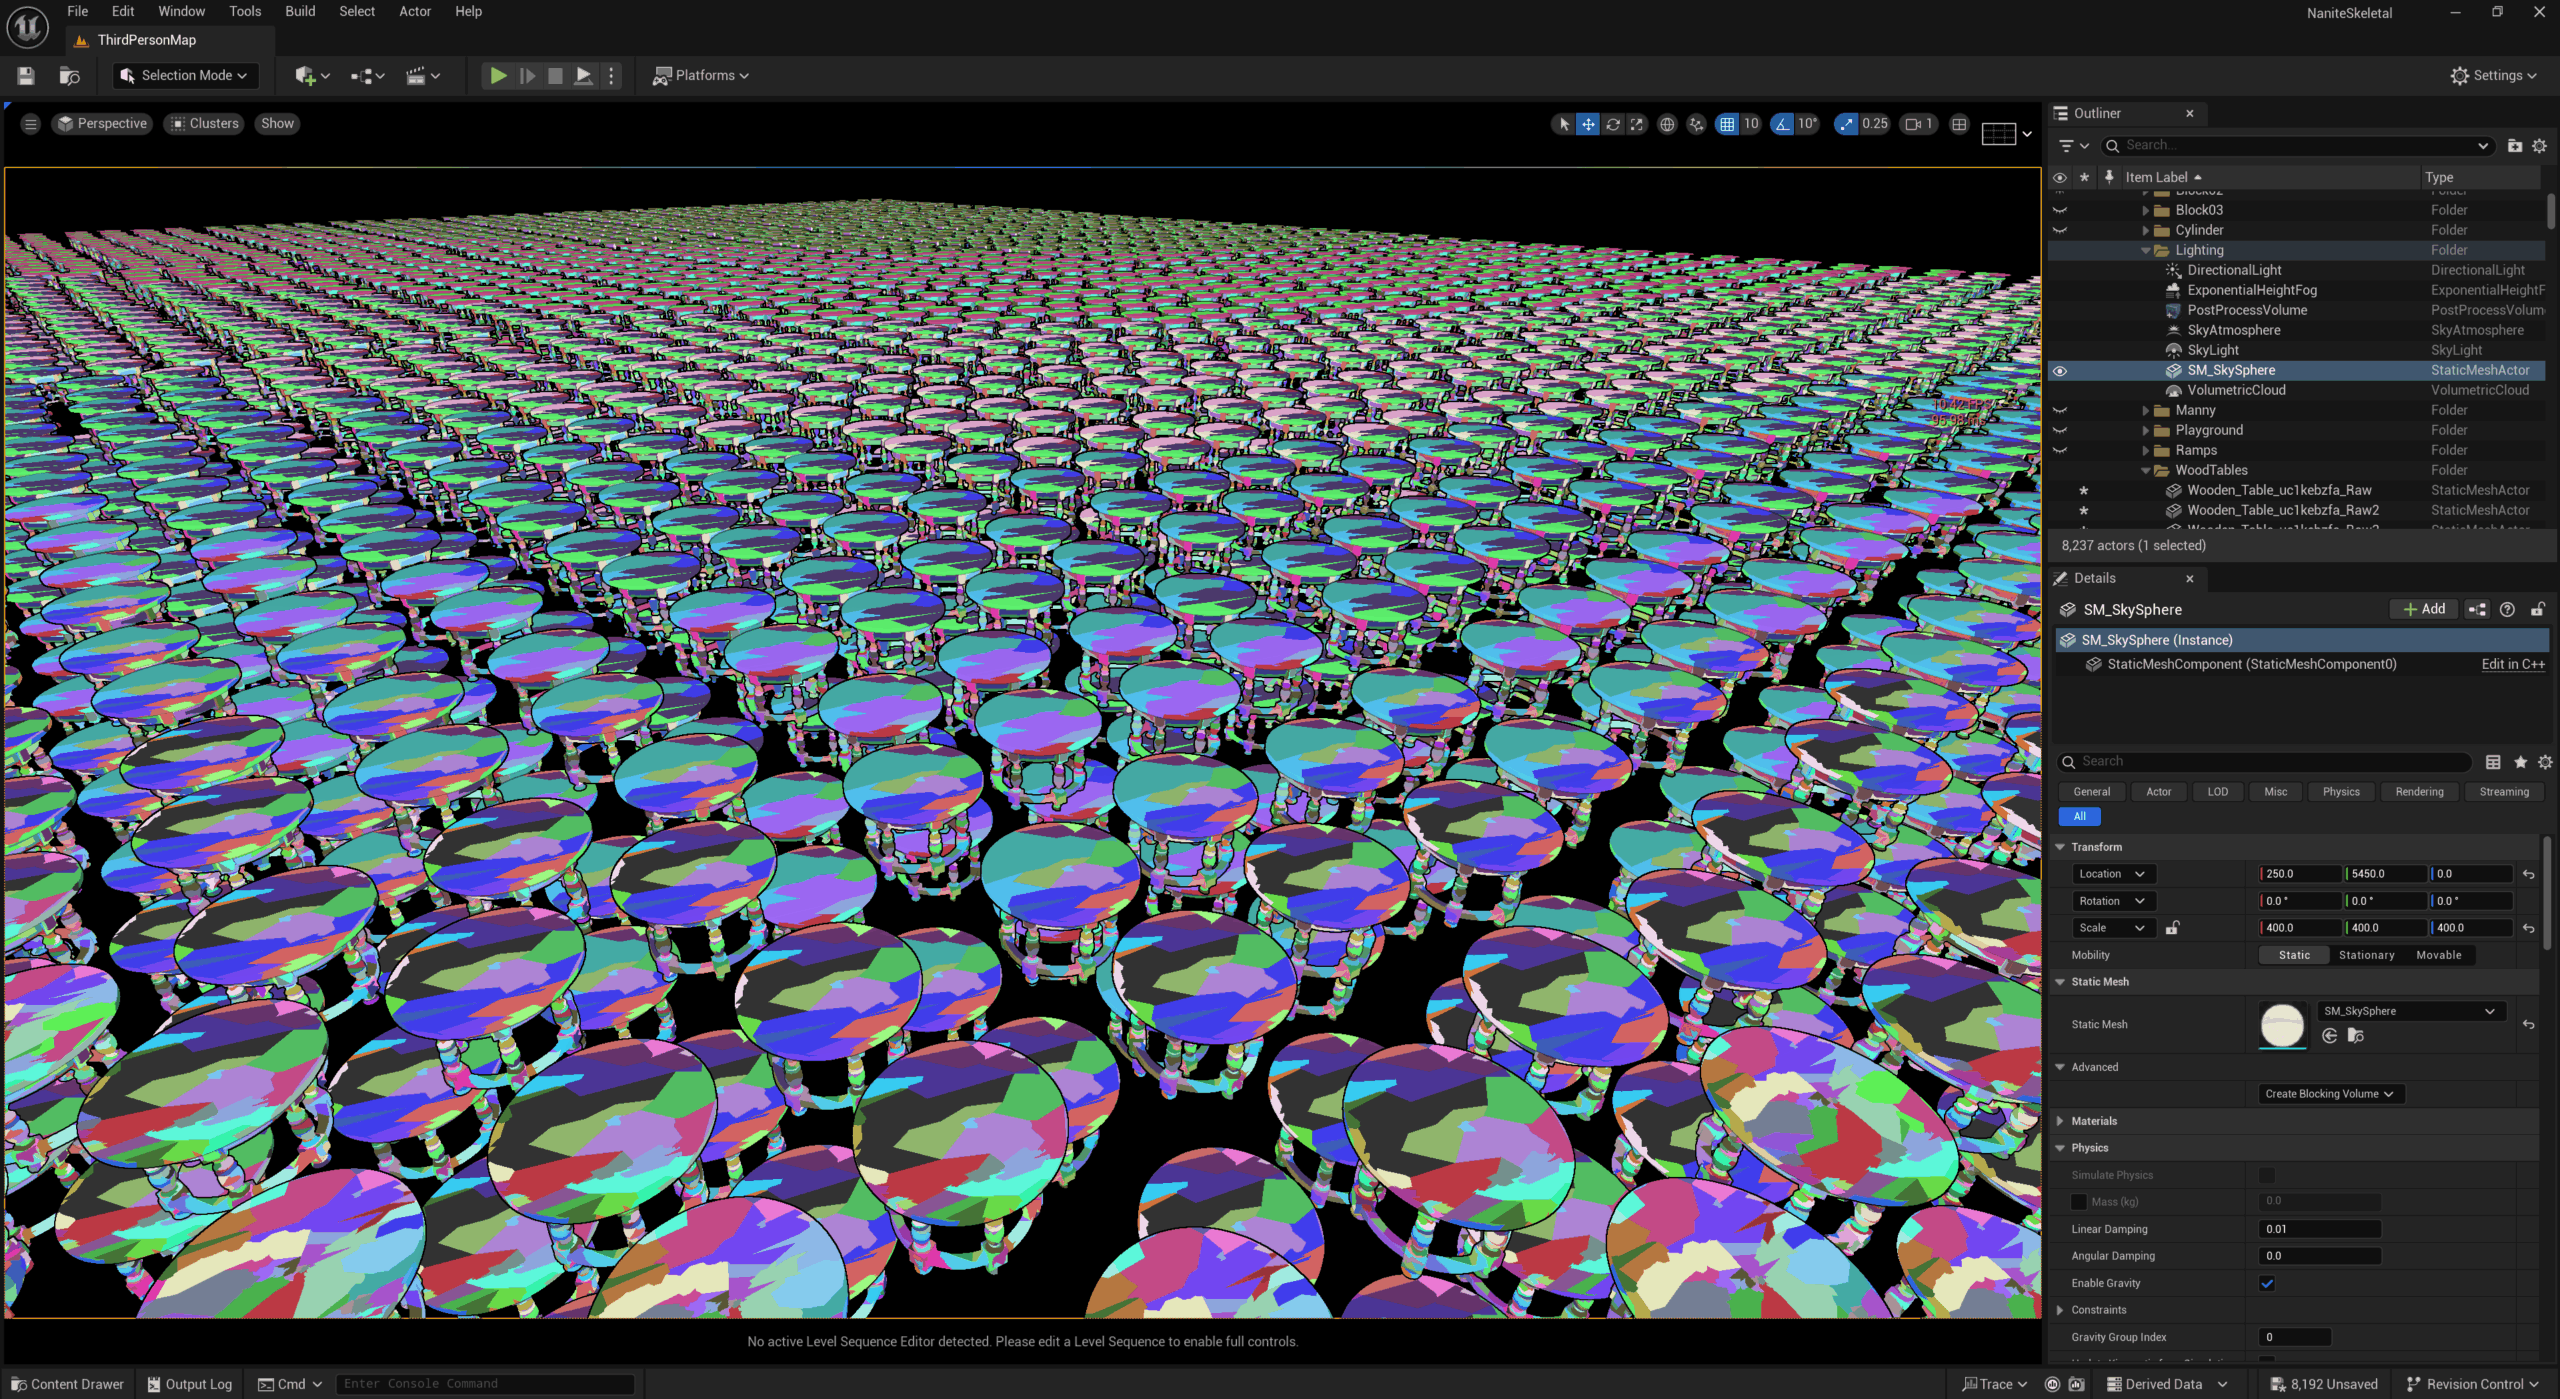
To enable: View Mode → Nanite Visualization → Overview.
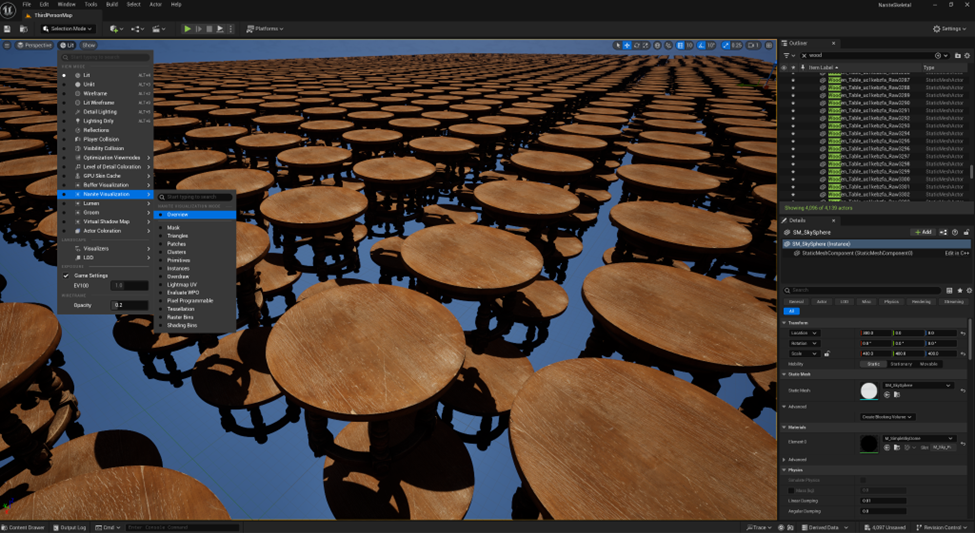
This will give you a visual representation of the rendering steps Nanite uses to create the geometry image below.
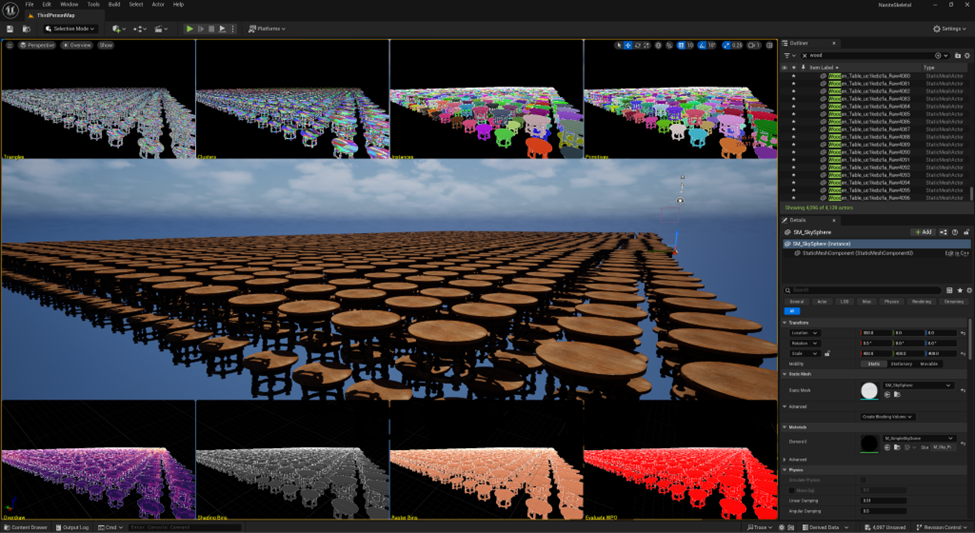
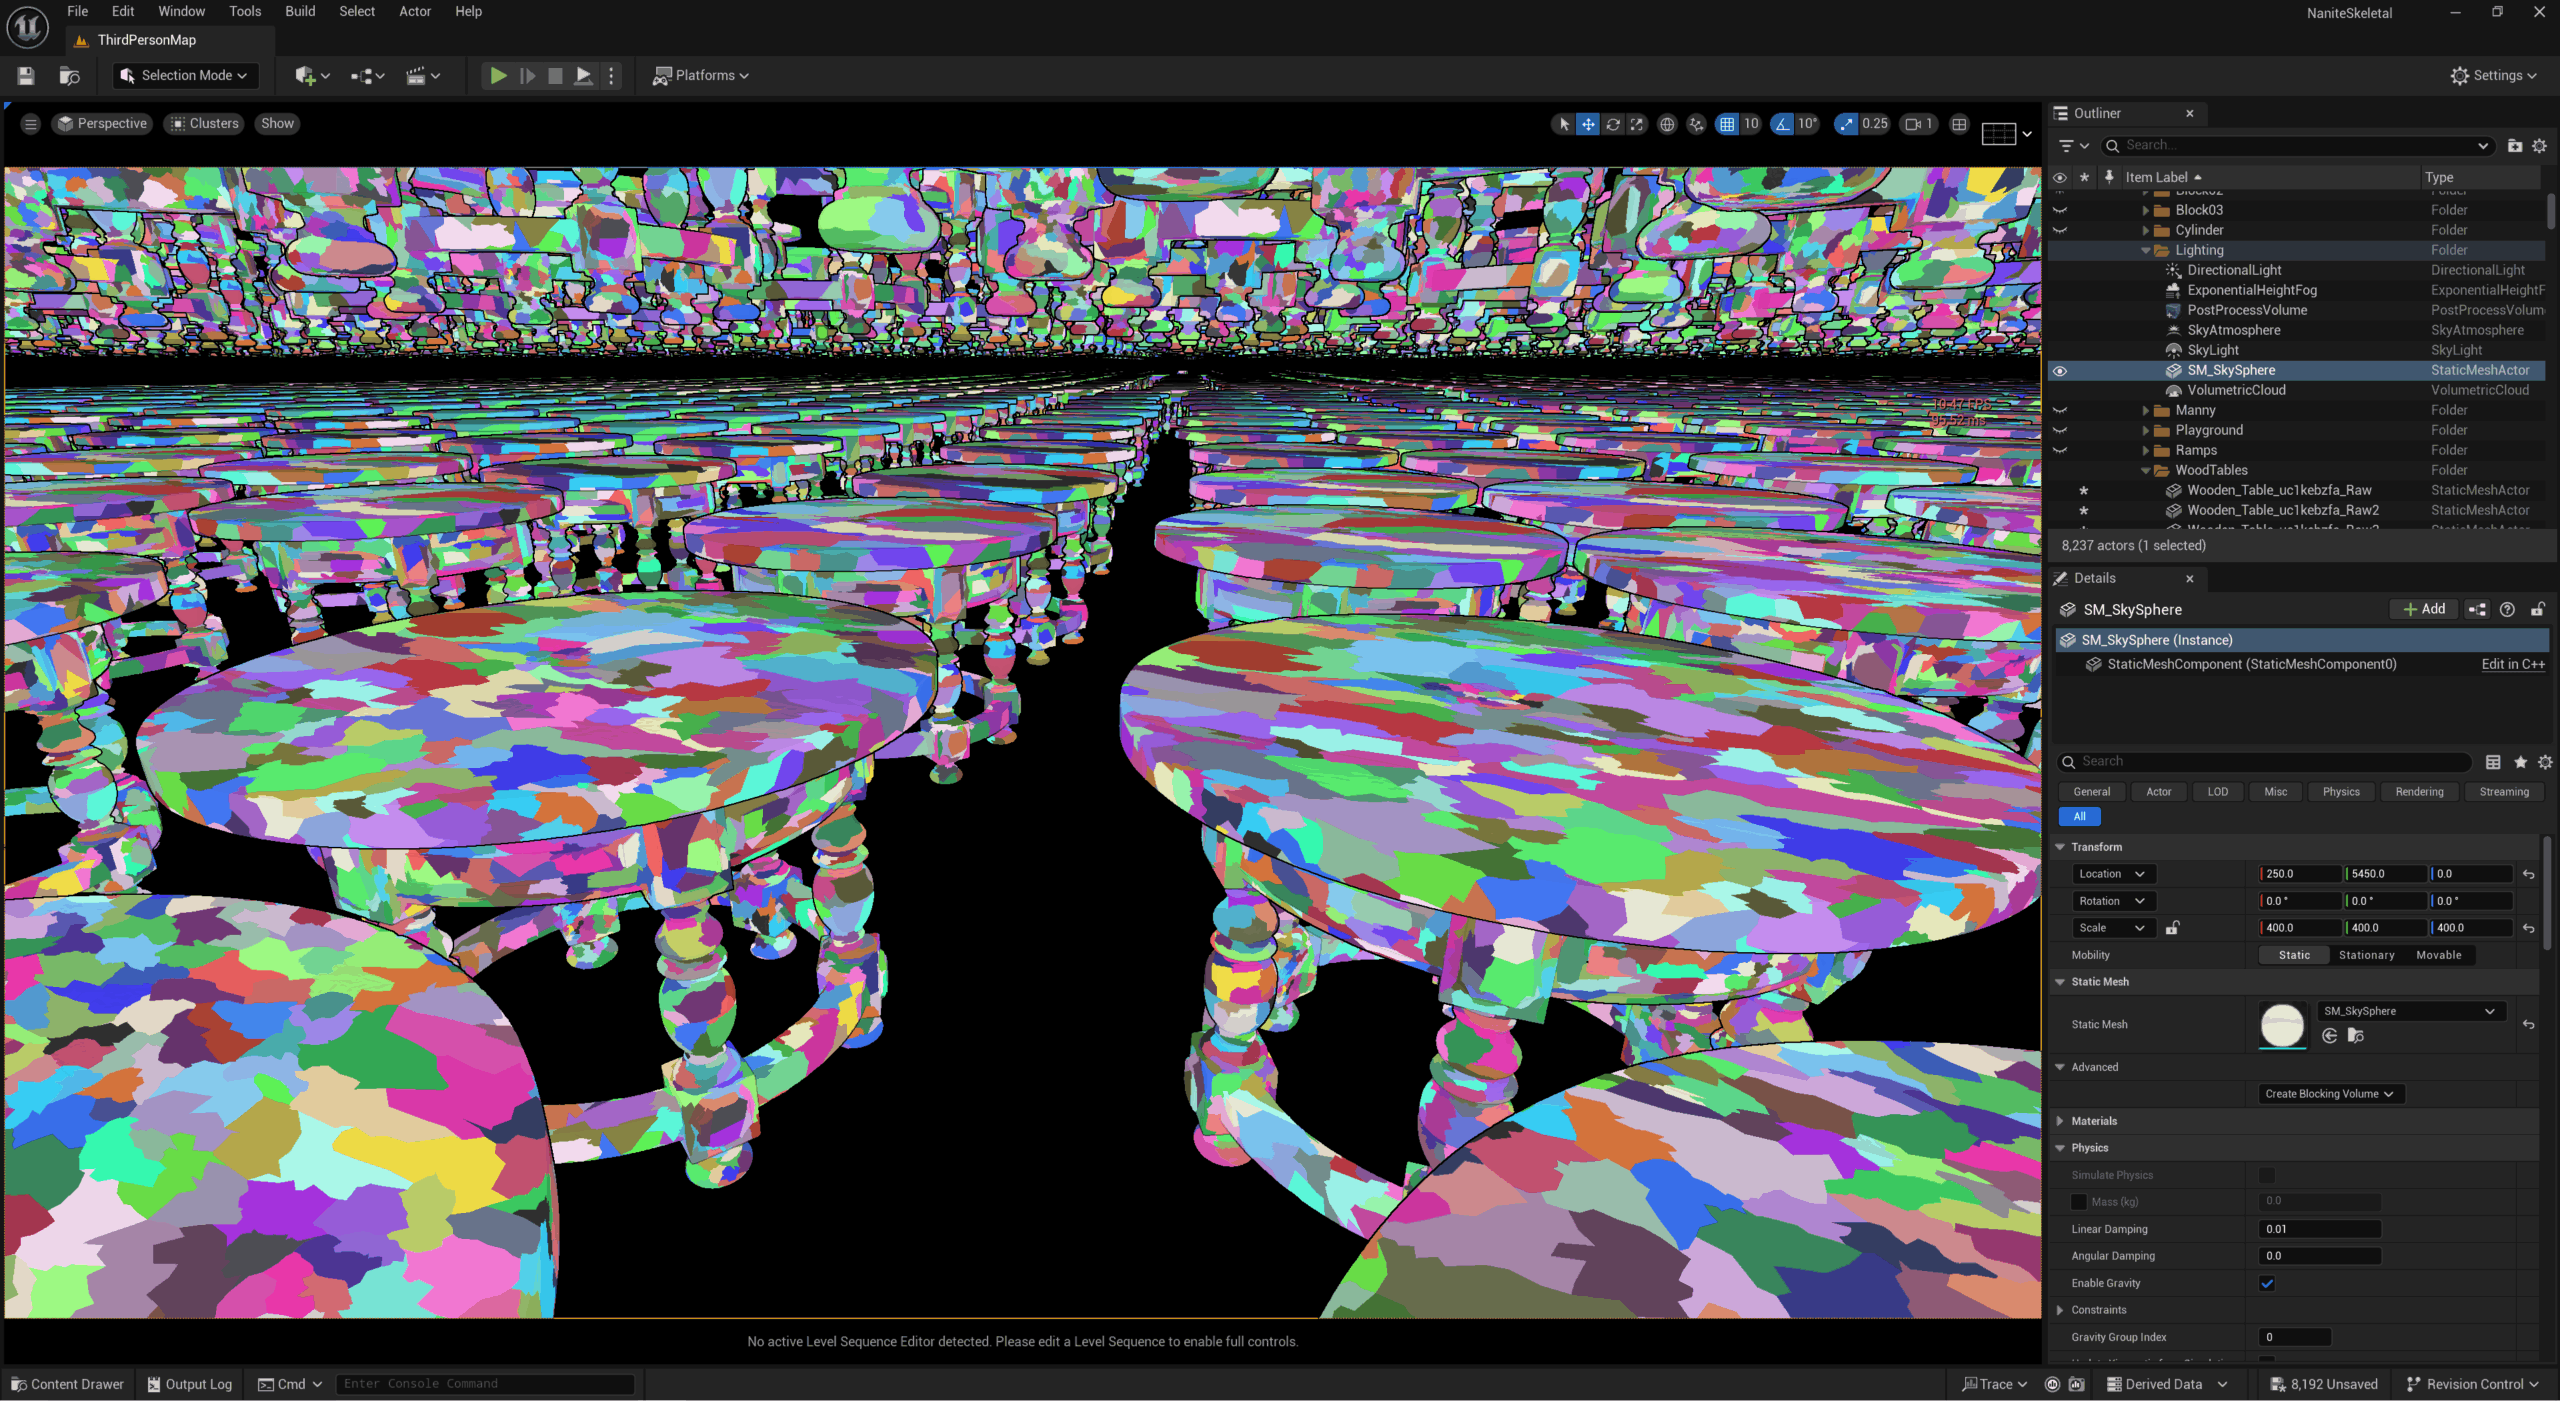
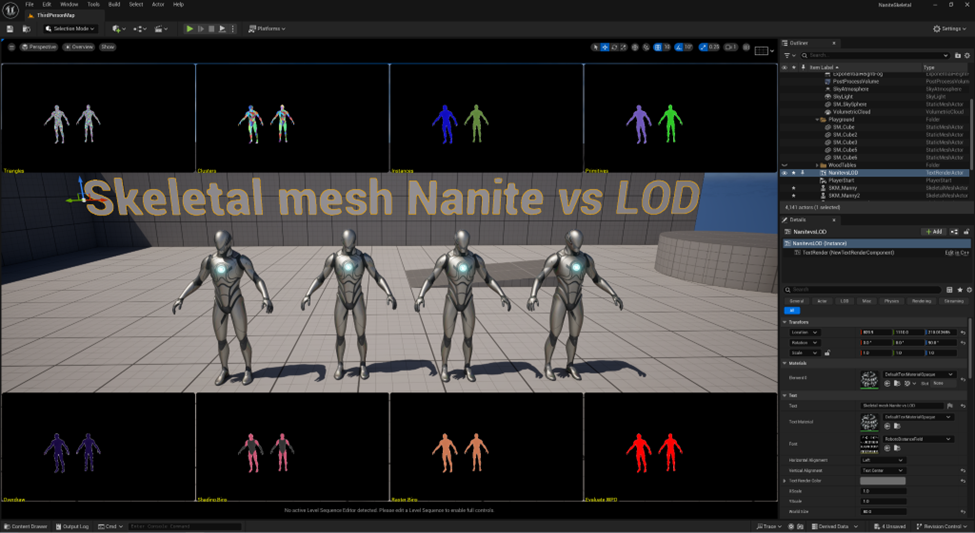
Screenshot: Nanite Visualization Overview, showing Triangles, Clusters, Instances, Overdraw, Shading Bins, Raster Bins, and EvaluateWPO.
An explanation of the visualisations in this screenshot are in the table below
Source (1)
| Nanite Visualization Feature | Description |
| Triangles | The triangles rendered to the scene. As objects get further away, the triangles tend to stay the same size. |
| Clusters | Nanite splits models into clusters that are broken down into triangles. Clusters also stay the same size in the distance, making distant objects appear to have fewer clusters than closer ones. |
| Instances | Represent the different objects in the scene. Nanite checks each object against its neighbours to see if it occludes or is occluded, important for overdraw considerations. |
| Primitives Visualization | Colours components the same colour for all instances in an Instance Static Mesh (ISM). |
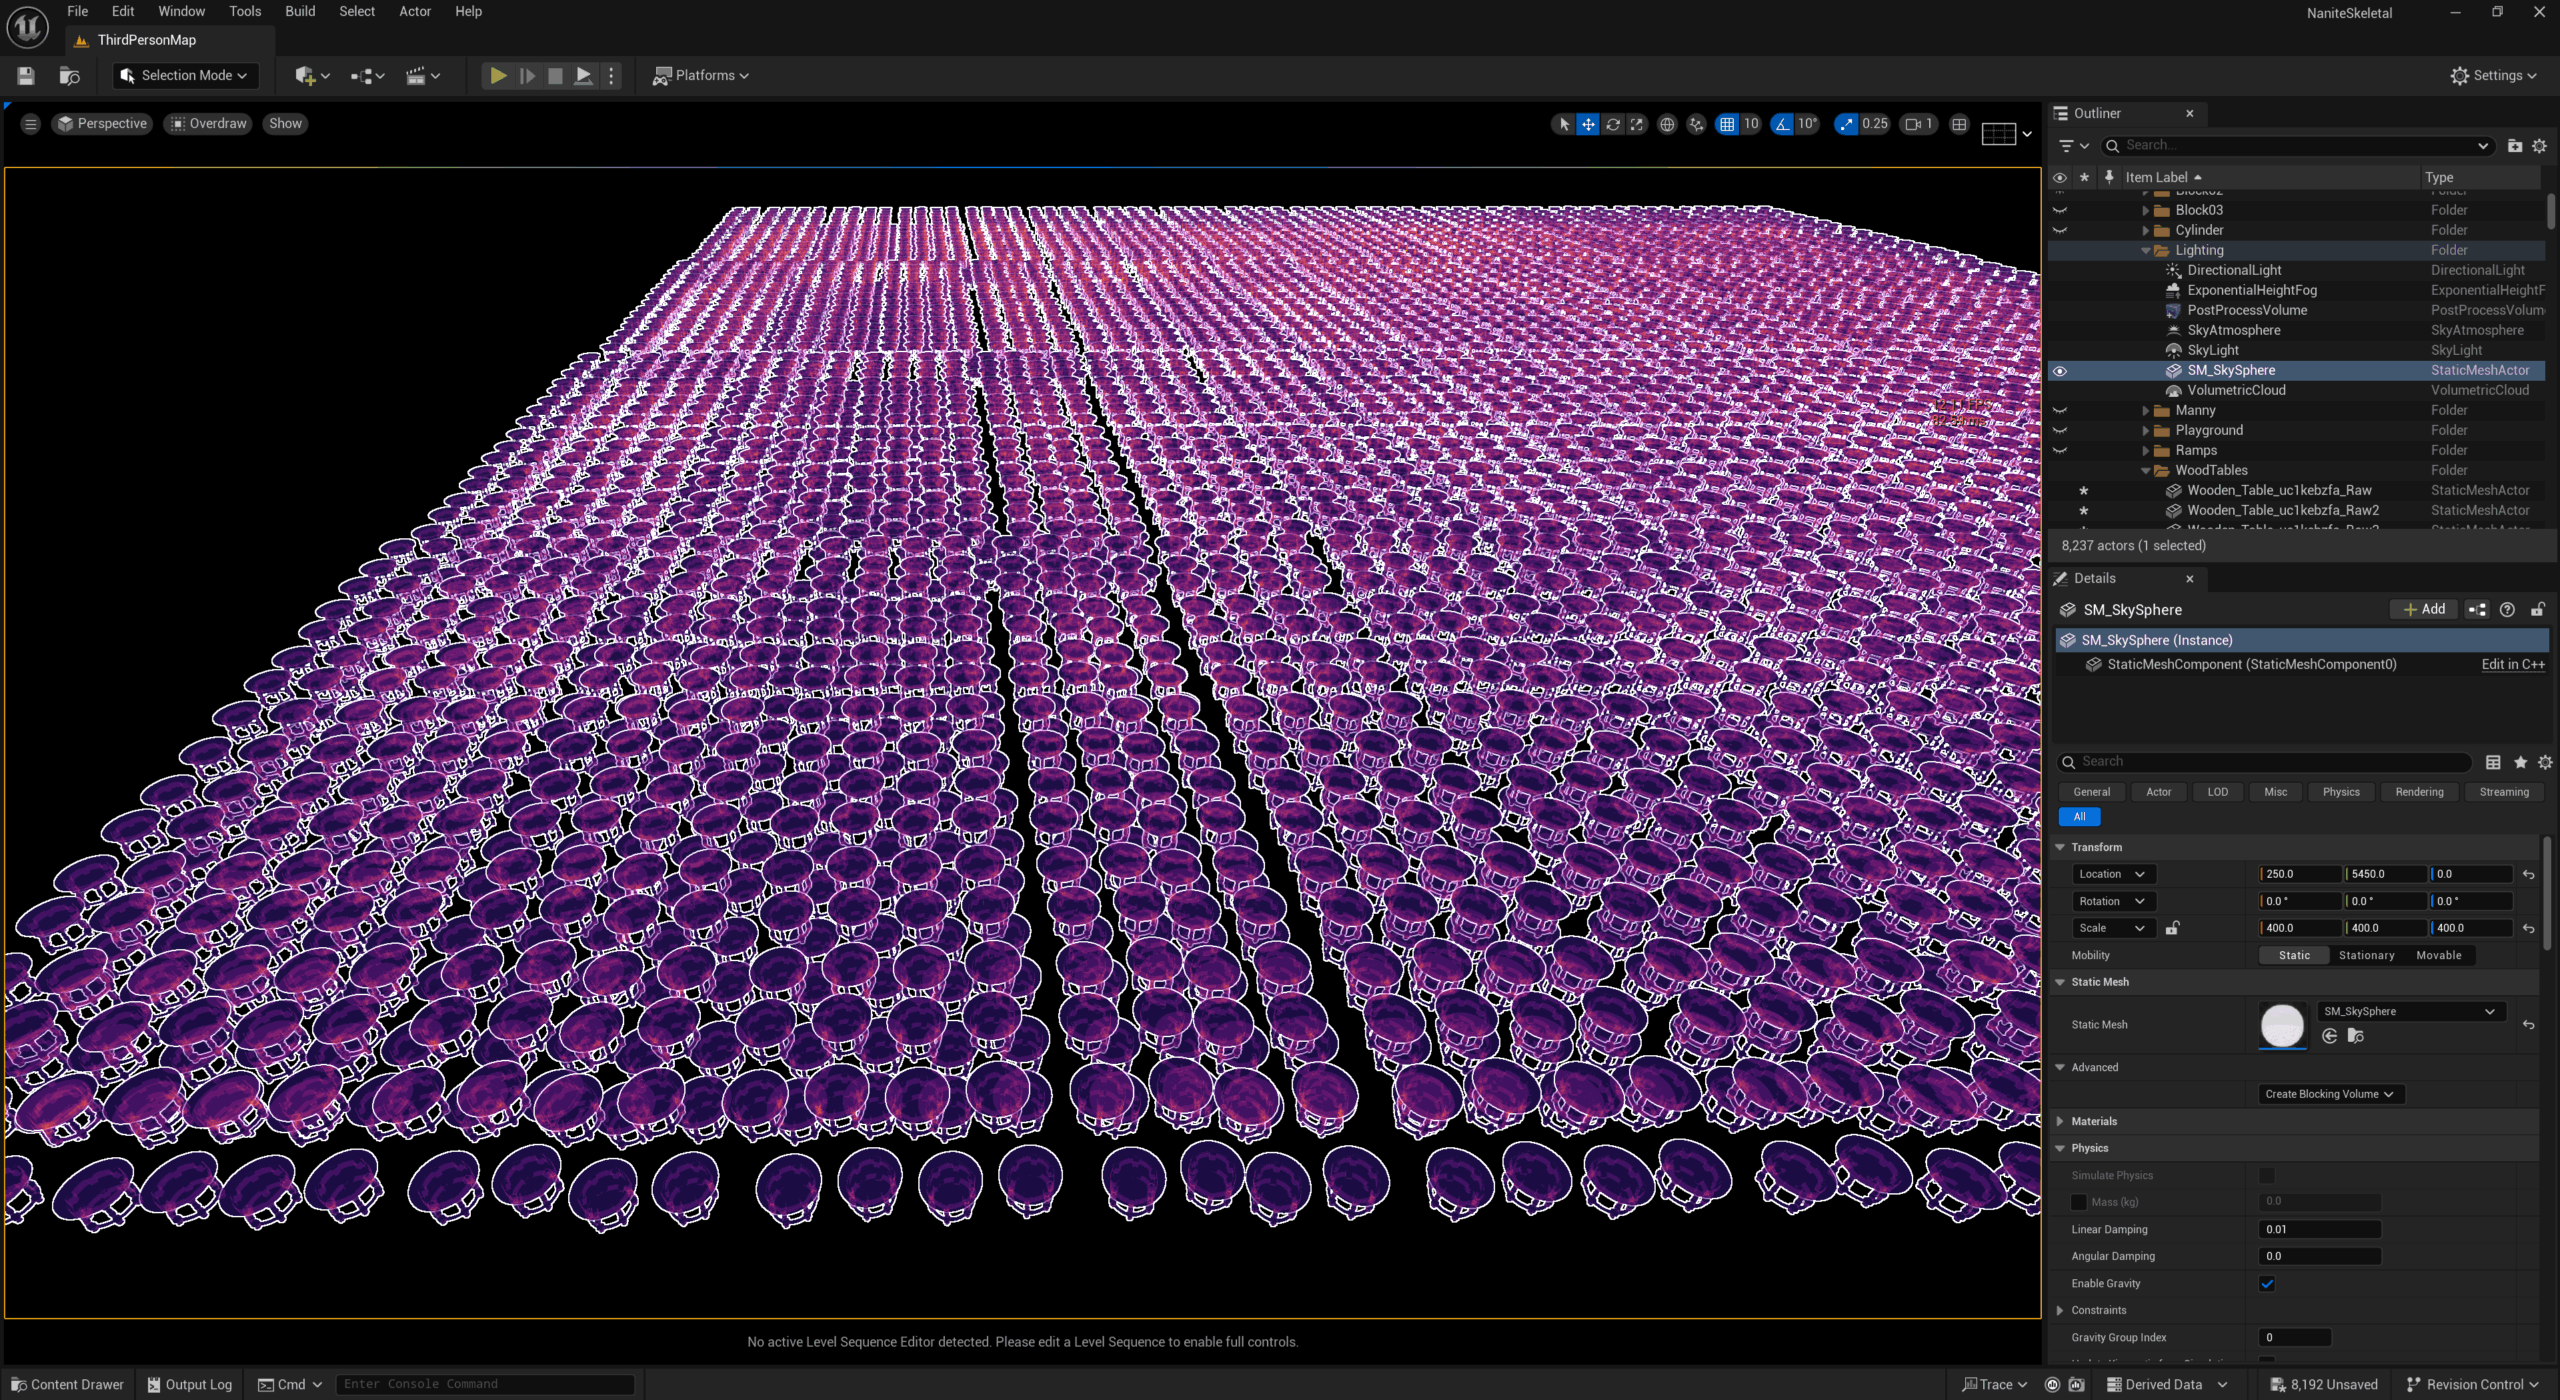
| OverDraw | Displays the amount of overdraw happening for scene geometry. All evaluated pixels, including masked-out pixels, are added. Smaller, closely stacked objects create more overdraw than larger ones. |
| Shading bins | A group of mesh clusters that share the same shader and material state, allowing the renderer to efficiently batch them together. |
| Rasterbins | Displays groups that represent batches of geometry. |
| EvaluateWPO | Colours Nanite-enabled geometry that are using world position offset (green) versus ones that are not (red). |
Table 1
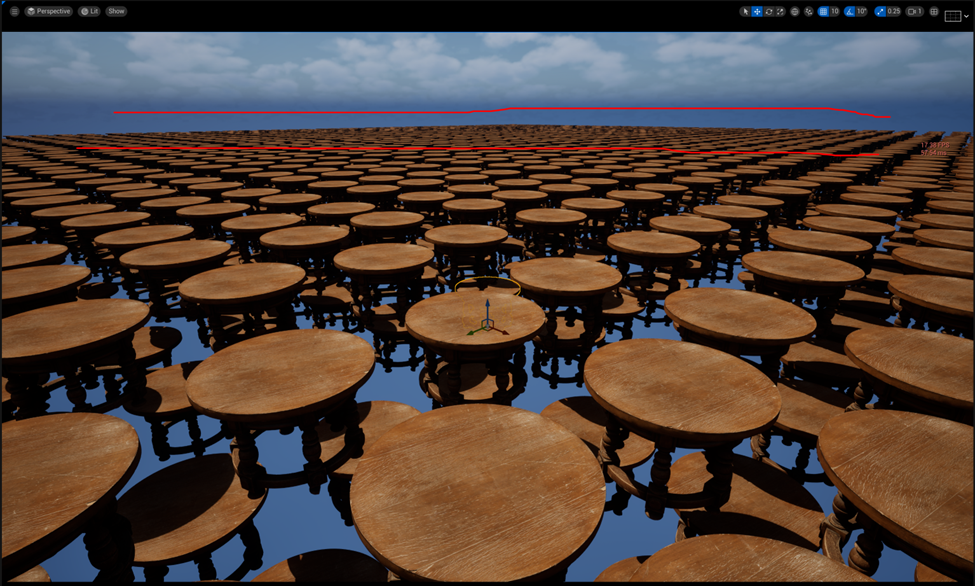
Note: Over draw is one area Nanite suffers from when two objects are close together so be aware that this scenario is easy to replicate in game if you are not careful.
Shimmering can be observed on distant objects that overlap each other. This happens because Nanite does not know which object to draw over another due to the pixels being too small in the depth buffer.
In the Overdraw visualisation below, areas of purple and yellow/orange are visible. Purple indicates low overdraw (good performance), while orange indicates high overdraw (potential performance issues). So, we have areas where Nanite is fighting itself as it does not know which pixel has priority. Useful information to know and a telltale sign in more complex scenes.

However here using the Lighting only debug view revealed a shadow artifact in the lighting that causes shadows to shimmer in the distance.
Does Nanite Make a Difference?
Disabling Nanite reverted to the original, high-poly Megascan mesh.
Duplication: Now we instance the meshes and watch to see if anything different happens.
Testing duplication again led to predictable results: after 256 instances, the GPU and system hit their limit. It became clear this was not a fair test — the Megascan data was simply too dense (~200,000 polygons per mesh) to compare directly without proper LODs.
Convert to Nanite summary:
Nanite delivers impressive scalability even on older hardware, efficiently handling thousands of instances with minimal performance loss — though screen-space coverage and memory limits still play a role. But this is just the first step.
Key tip: Always monitor screen-space coverage and GPU timing when stress-testing Nanite; more instances don’t necessarily equal worse performance, but larger visible areas can quickly increase GPU load.
Comparing Nanite to traditional LOD
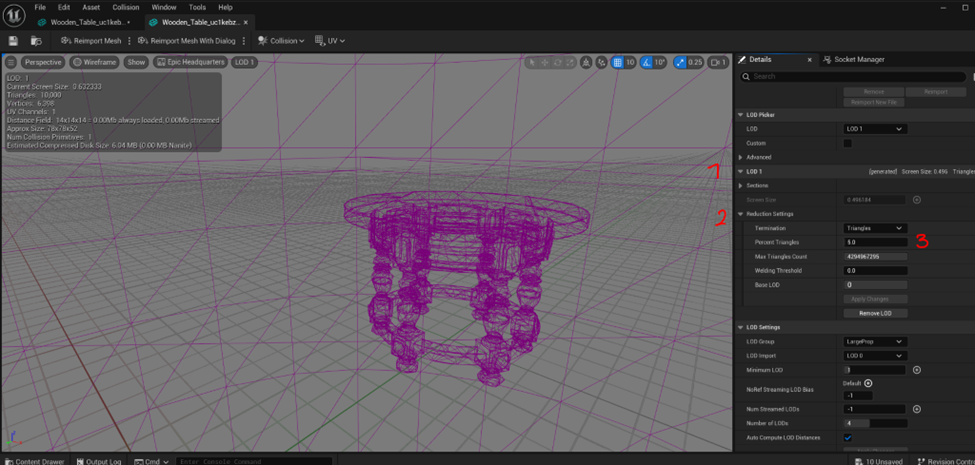
The next goal was to compare Nanite meshes to traditional LOD structures. I forced LODs by adjusting the parameters in the LOD section (e.g., setting ~5% triangle reduction for four LODs) and created a reduced LOD mesh using UE5’s built-in tools.
Creating LODs using UE5
Creating LODs Using UE5 is not necessary, however it can be done on import or if you wish to add LODs to an existing static mesh please try the following. In this case I was starting from an extremely dense mesh. So, this was an auto LOD torture test.
- Open the LOD rollout
- Open reduction settings
- Set percentage
- triangles LOD0 (5%) repeat for LOD 1(2.5%),2 (1%) ,3 (0.5%)
- Press Apply changes and the reduction will begin.
Note: you can change each LOD level individually by changing the parameters then applying the changes to that LOD only. You do not need to create all LODs at the same time.
Warning: LOD visual quality can vary drastically depending on the auto-reduction settings and source mesh topology.
Testing the LOD version:
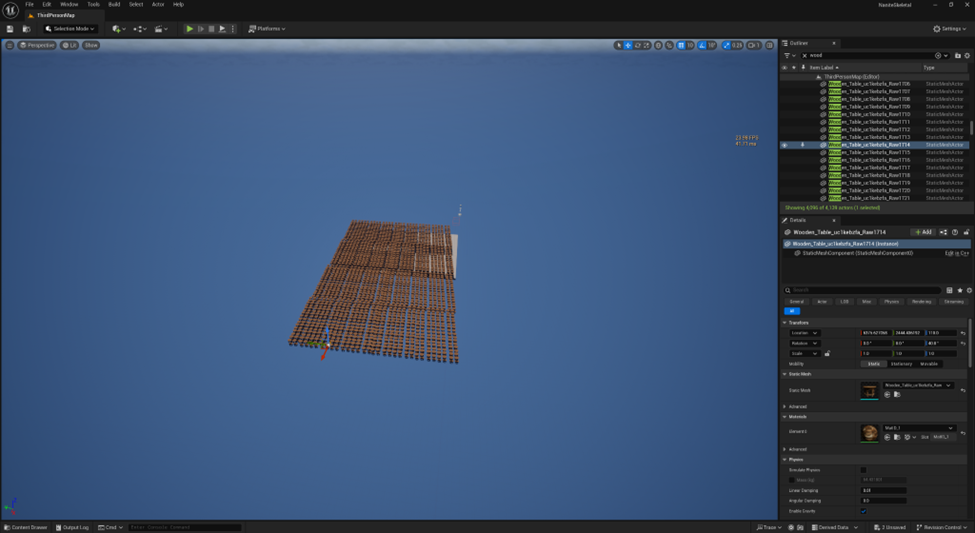
Replacing meshes in outliner:
Instead of duplicating the meshes again we can swap meshes in the outliner
- In The outliner search you can type the name of the mesh you wish to select. In this case “wood”
- This will automatically select objects whose name contains the string ”wood”. If the objects are hidden, they will be displayed in outliner but not selected,
- This will allow you to select them with Shift + Left Click.
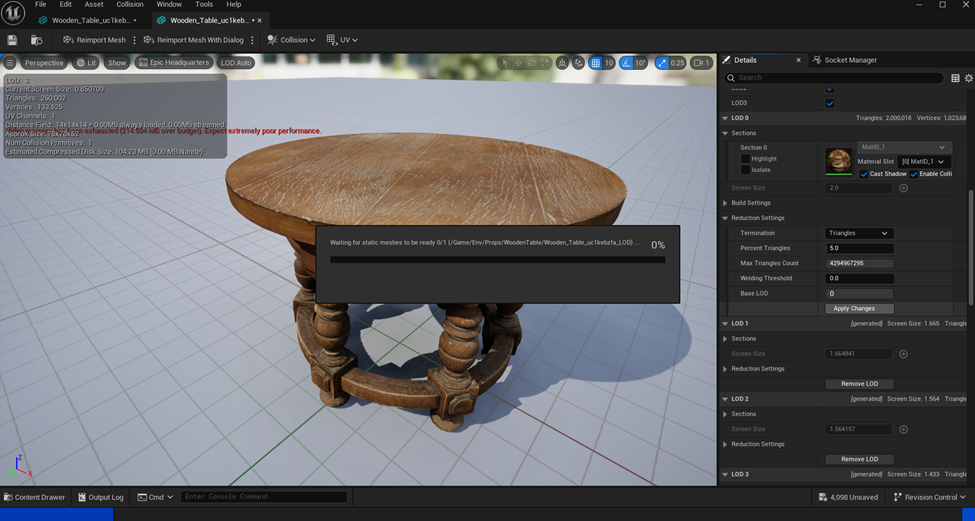
- Replace the Nanite mesh with the traditional LOD version of the mesh I named “Wooden_Table_uc1kebzfa_LOD”
All files are replaced, now time to test.
Warning: Once again do this slowly. If you accidentally change all meshes whilst they are visible to a mesh that is over budget your computer will crash! So be warned. This kind of issue can happen in production as well. Checking in such a change accidentally could affect the entire team. Always test carefully.
To make the meshes visible again use the eye icon next to the mesh in the outliner.

Performance Observations
- FPS before placing any mesh: ~23-24 FPS
- FPS after placing 1 mesh: ~20-21 FPS
- FPS after duplicating 2048 meshes: ~20 FPS
- FPS after duplicating 4096 meshes with full textures: ~19 FPS
- FPS after pulling away from the camera~ 21 FPS
- CPU/GPU balance: Trace shows more GPU-side cost increase as screen coverage rises
- Were there any instances of stuttering, freezing, or crashes? Stable (but previous tests crashed when VRAM was exceeded due to changing model to a high poly density mesh)
- RAM or VRAM usage spikes? High but manageable on RX 580; no crash observed at 4096 instances
LOD Vs Nanite Visual Comparison Summary
Results were surprisingly close to the Nanite meshes. At close distances it maintained 20FPS.
Results were slightly better at greater distances, staying above 19 FPS
However, the quality of the generated LODs can be inconsistent and is highly dependent on the quality of the original LOD models segmentation. Nanite has a very consistent feel and smooth transition quality. So, in short, the outcome of the ‘how many can we put on-screen’ test was unexpectedly similar. To the Nanite meshes. While results might have been marginally improved at greater distances, the automatically generated level of detail (LOD) quality exhibited inconsistency jumping from smooth to blocky without respecting the shape of the mesh. Generating proper LODs can achieve similar quality to Nanite but requires significant time investment to avoid quality degradation.
Lessons Learned
- Always check r.ScreenPercentage — hidden scalability overrides can skew benchmark results.
- Nanite excels at simplifying asset management and bypassing manual LOD work, but screen-space coverage still impacts GPU cost.
- Automatically generated LODs can perform well but often sacrifice visual quality; good LODs need manual care.
- Visualization tools like Overdraw and Shader Bins reveal valuable performance bottlenecks you might miss with raw FPS numbers alone.
- Tip: When mass-swapping high-poly assets, always hide meshes before replacement to avoid crashes.
LOD vs Nanite: Performance Case
Previously we showed how Nanite and LODs can be comparable in appearance and performance under an easy workload. With a focus on visual quality. However, let’s examine how Nanite and traditional LOD-based rendering behave under extreme stress: 8,192 mesh instances, each with 3 LODs. Nanite as it is.
Test Setup
- Scene: 8,192 identical static mesh actors
- LOD Mesh: 3 LOD levels, lowest LOD visible at long range
- Nanite Mesh: Equivalent model converted to Nanite
- Profiling: Bookmarks and screenshots captured in Unreal Insights
- Key Metric: Frame time and performance across multiple view positions
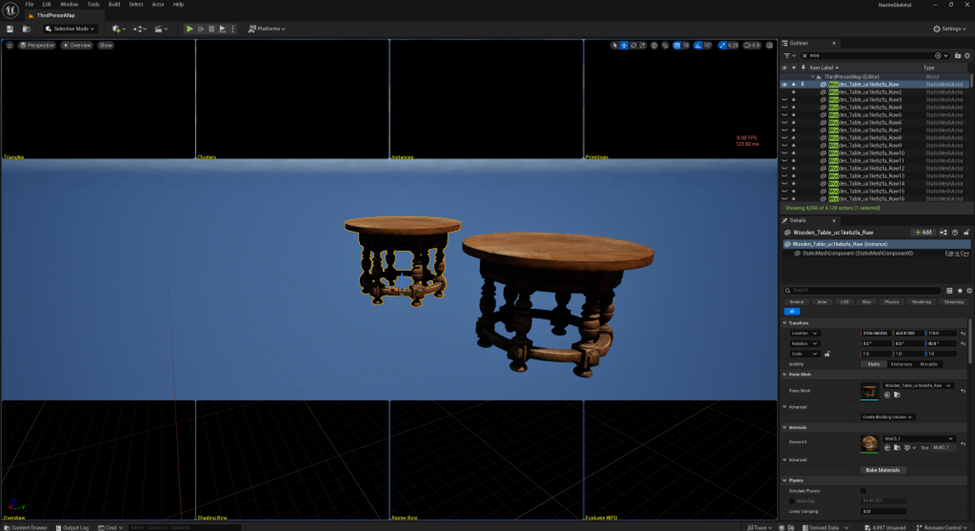
- Lighting: Flat shading with unlit mode to isolate geometry impact from lighting effects
Performance Summary
| LOD (FPS) | Nanite (FPS) | |
| Bookmark 9 | 47–49 FPS | 55–58 FPS |
| Bookmark 5 | 49–53 FPS | ~60 FPS |
| Bookmark 1 | 28–29 FPS | ~60 FPS |
| Bookmark 0 | 45–47 FPS | ~60 FPS |
| Extreme Distance | 24 FPS (drop) | ~60 FPS |
The Screenshots below show the experiment and the bookmark locations for each of the stress points. Together with their LOD visualisation.
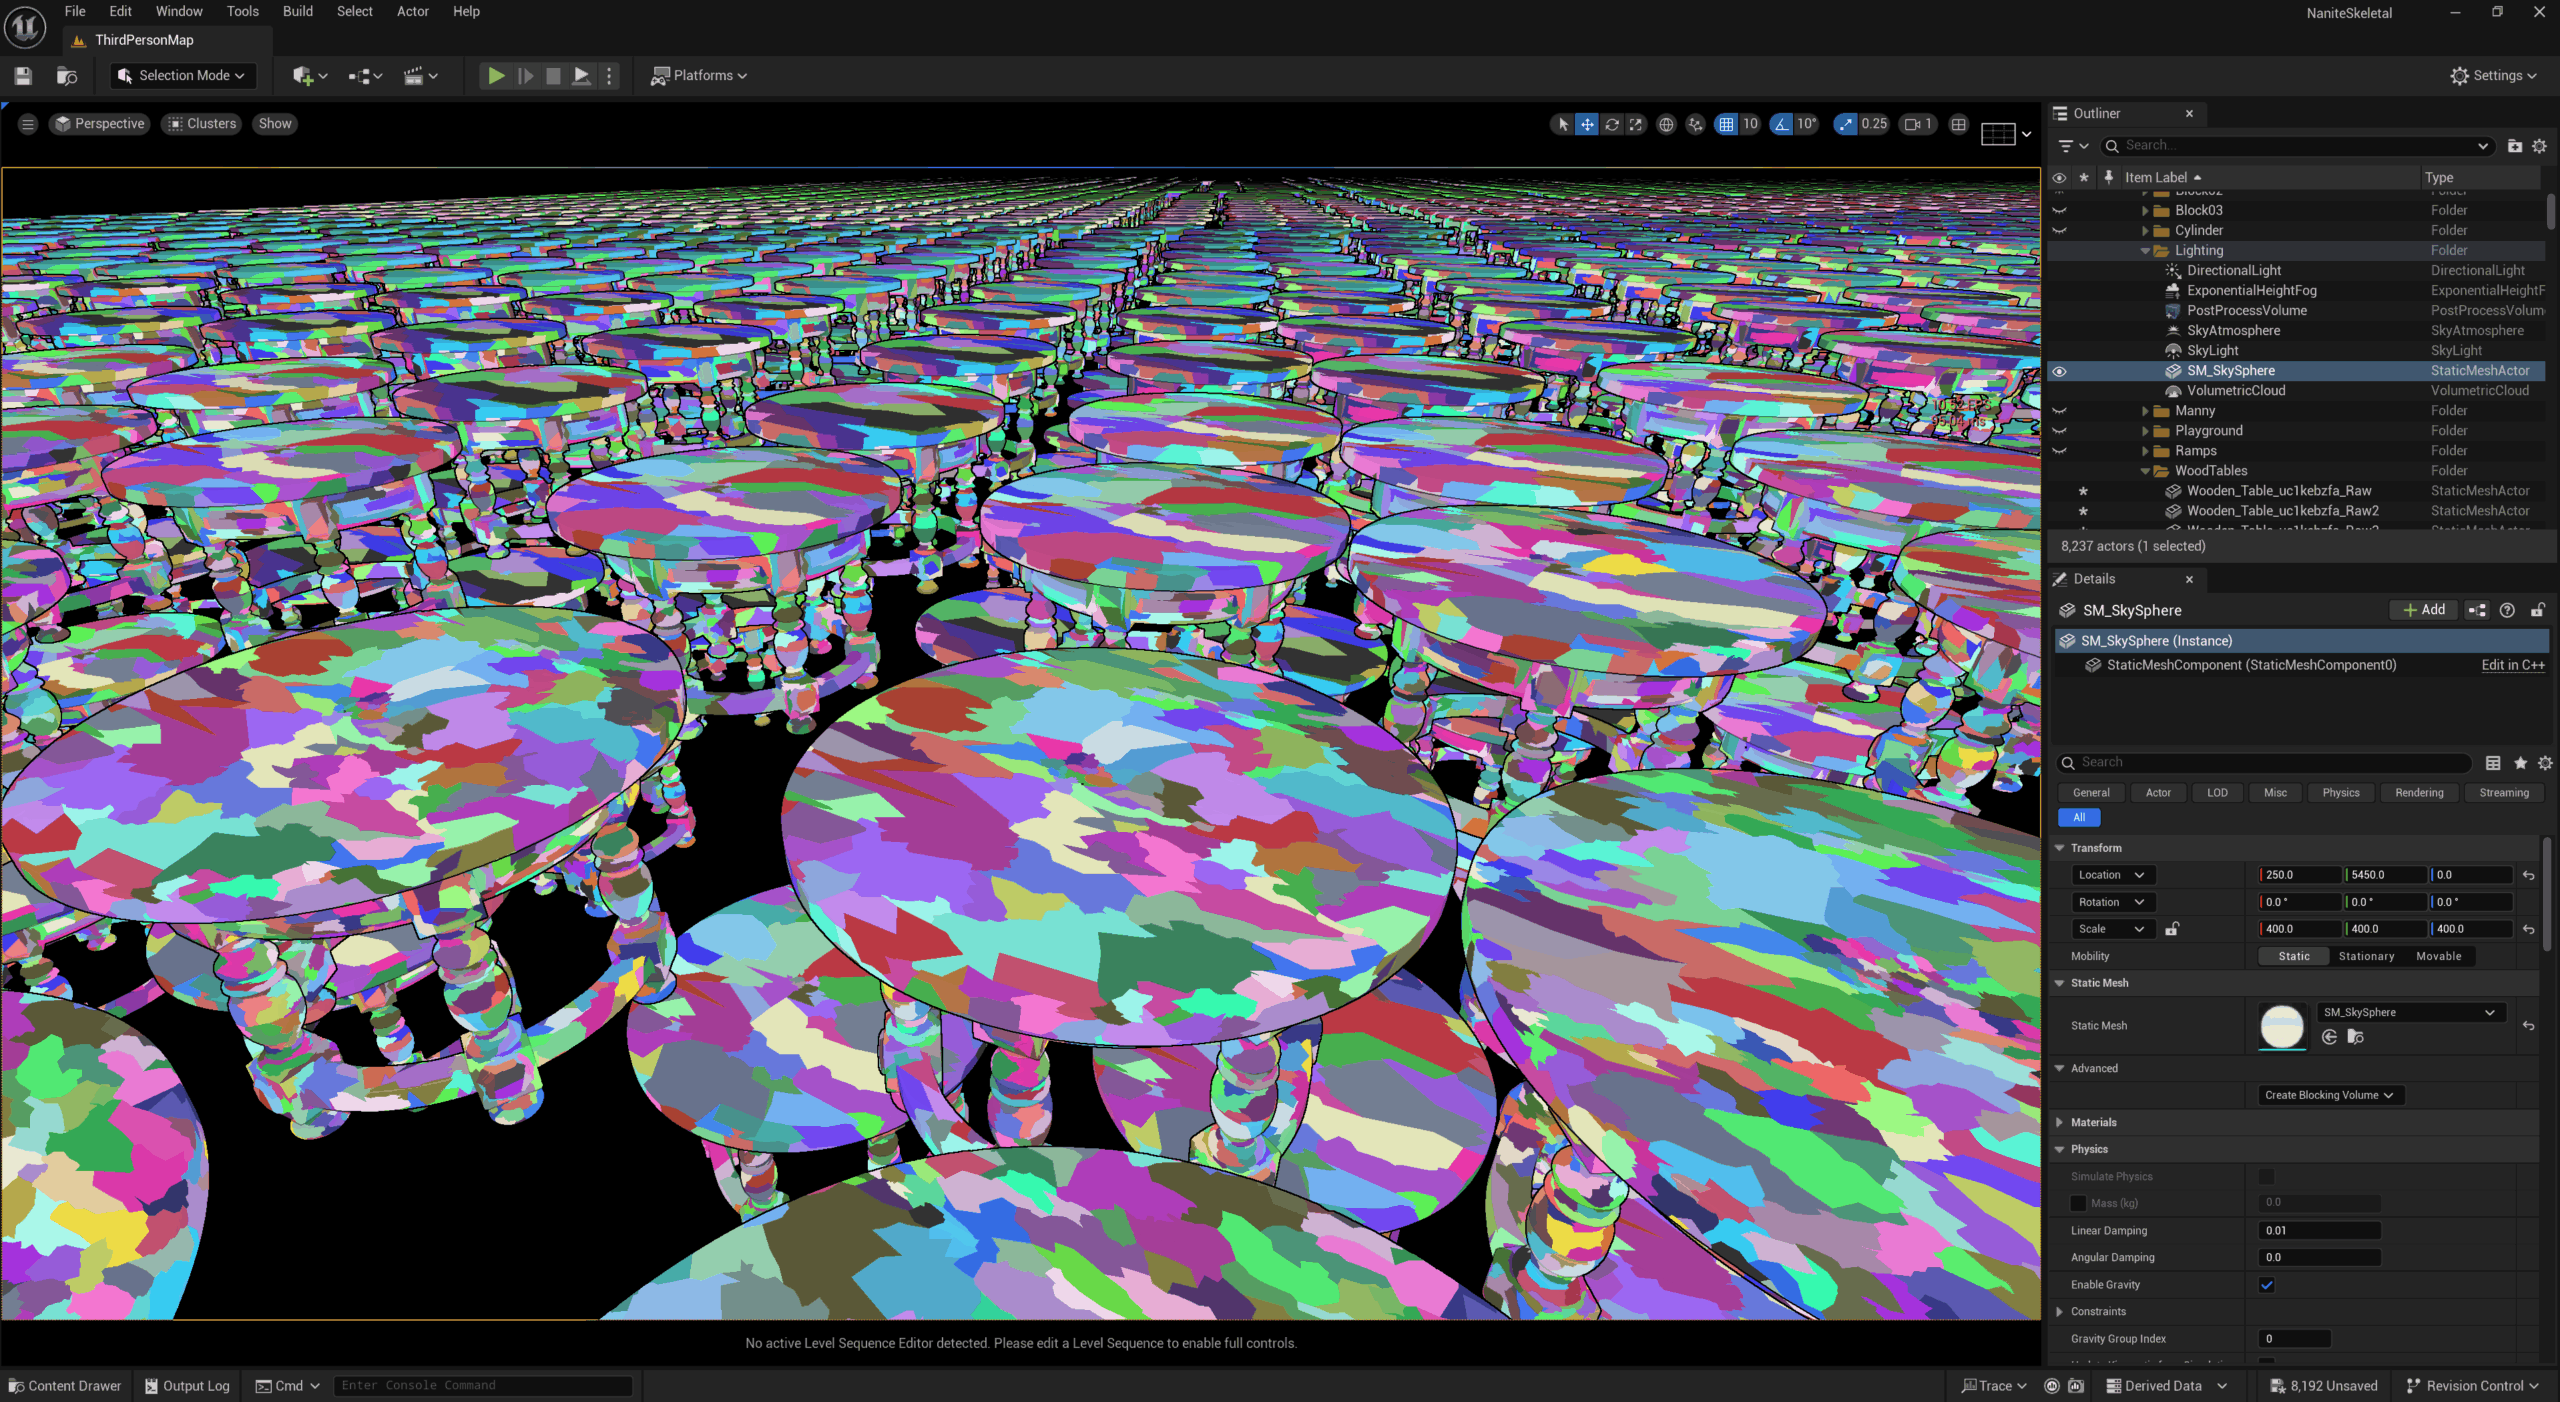
LOD: Test Images
Table contains LOD version data and images
 | 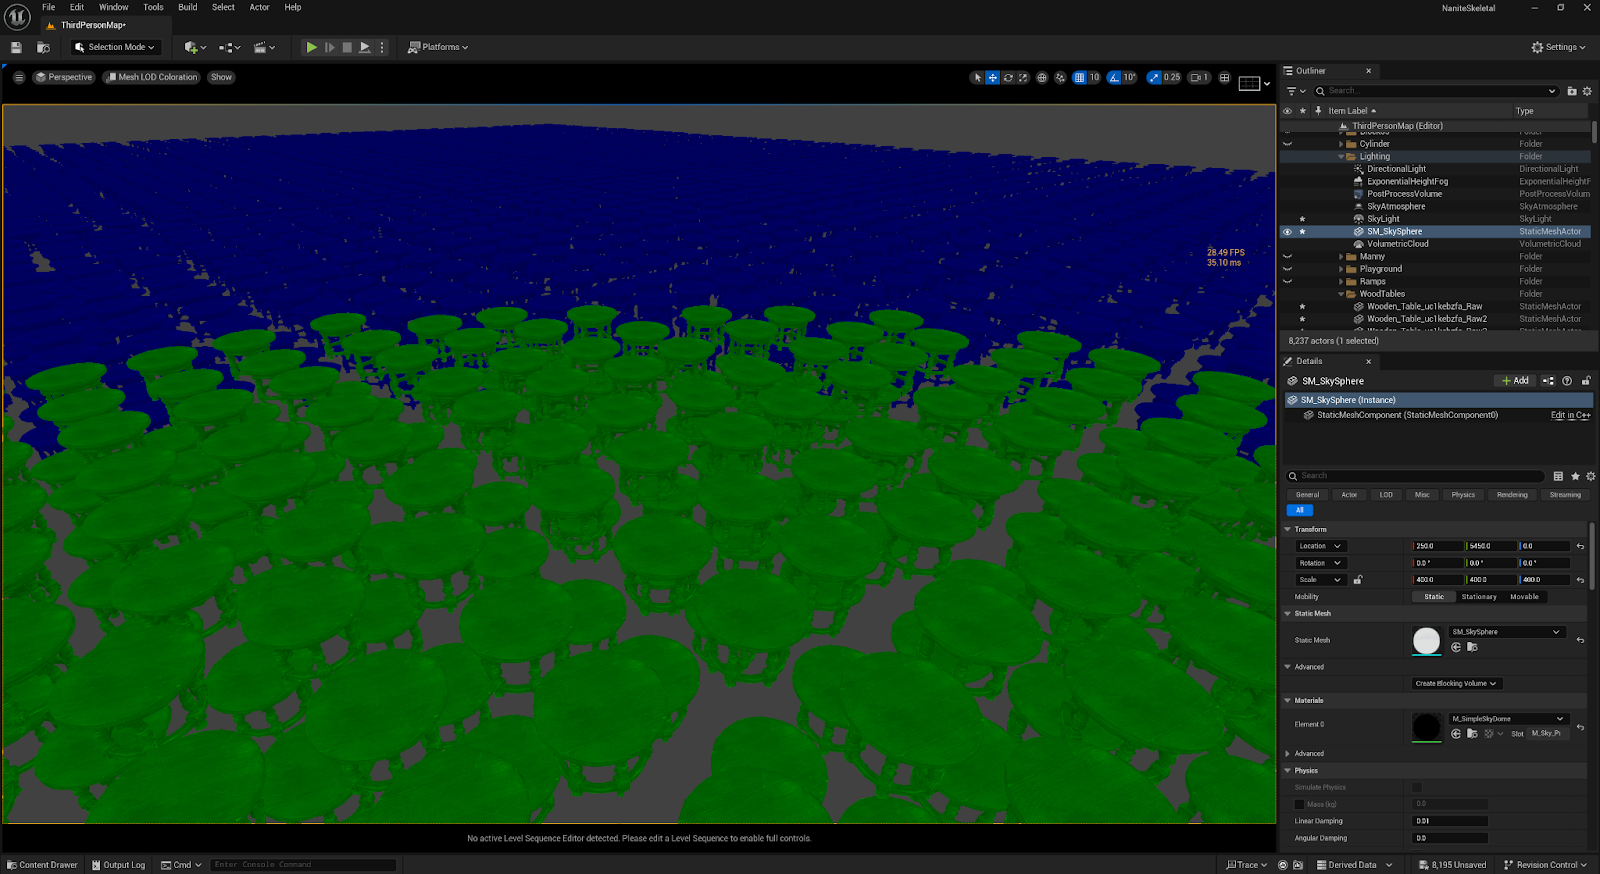 |
| Bookmark9, 47-49FPS | |
 |  |
| Bookmark5, 49 -53 FPS | |
 |  |
| Bookmark1, 28- 29FPS | |
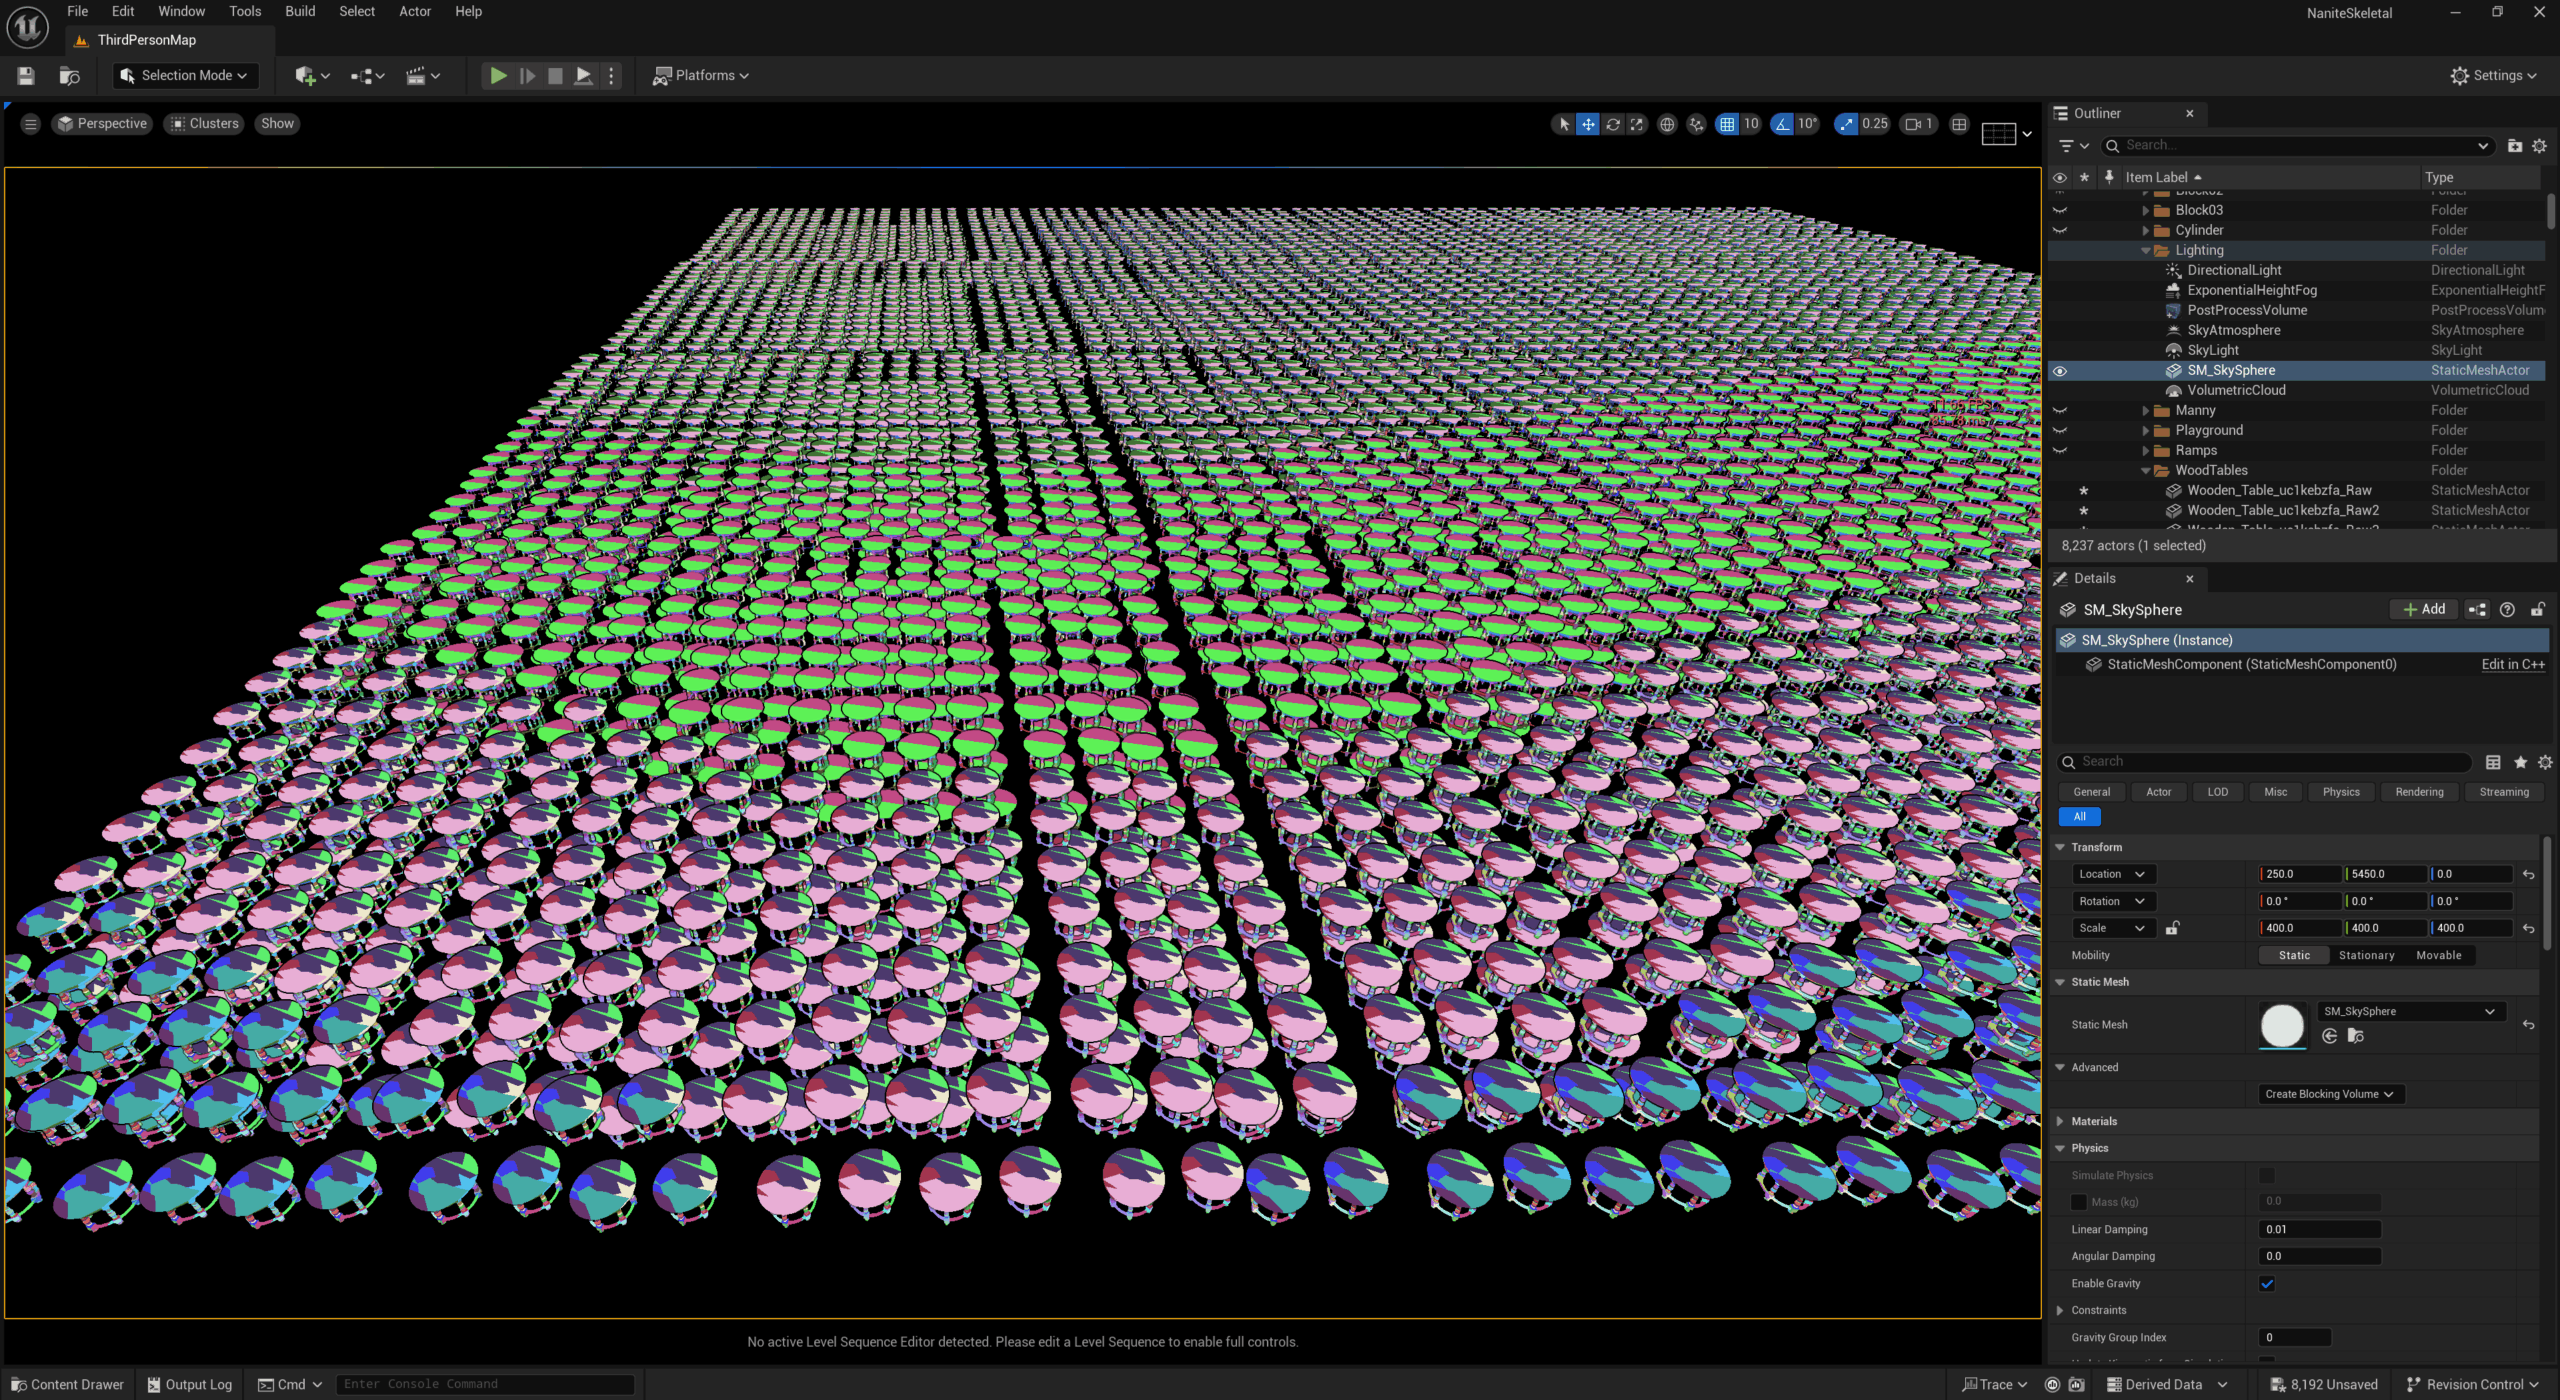
 |  |
| Bookmark0, 45-47FPS | |
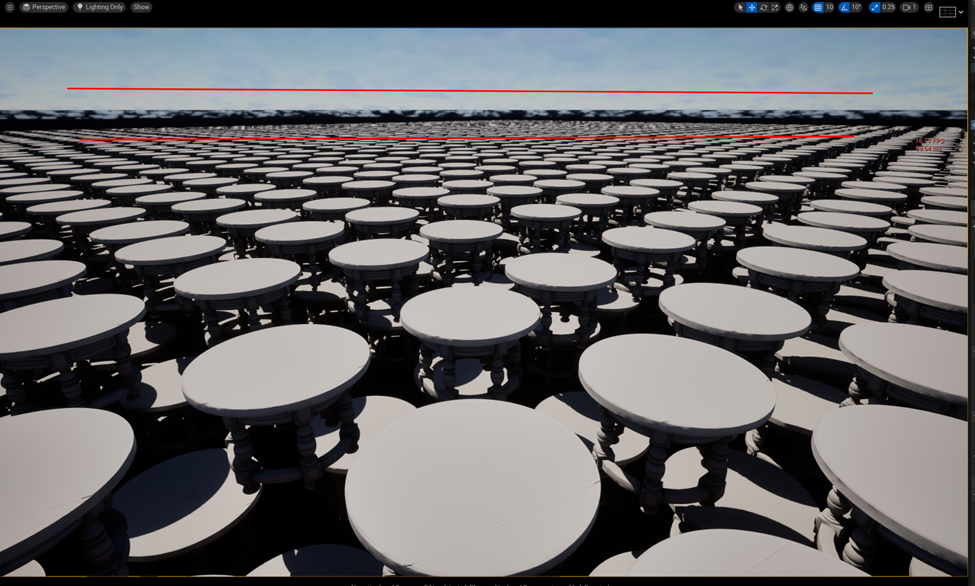
 |  |
| Extreme distance LODs 24FPS. |
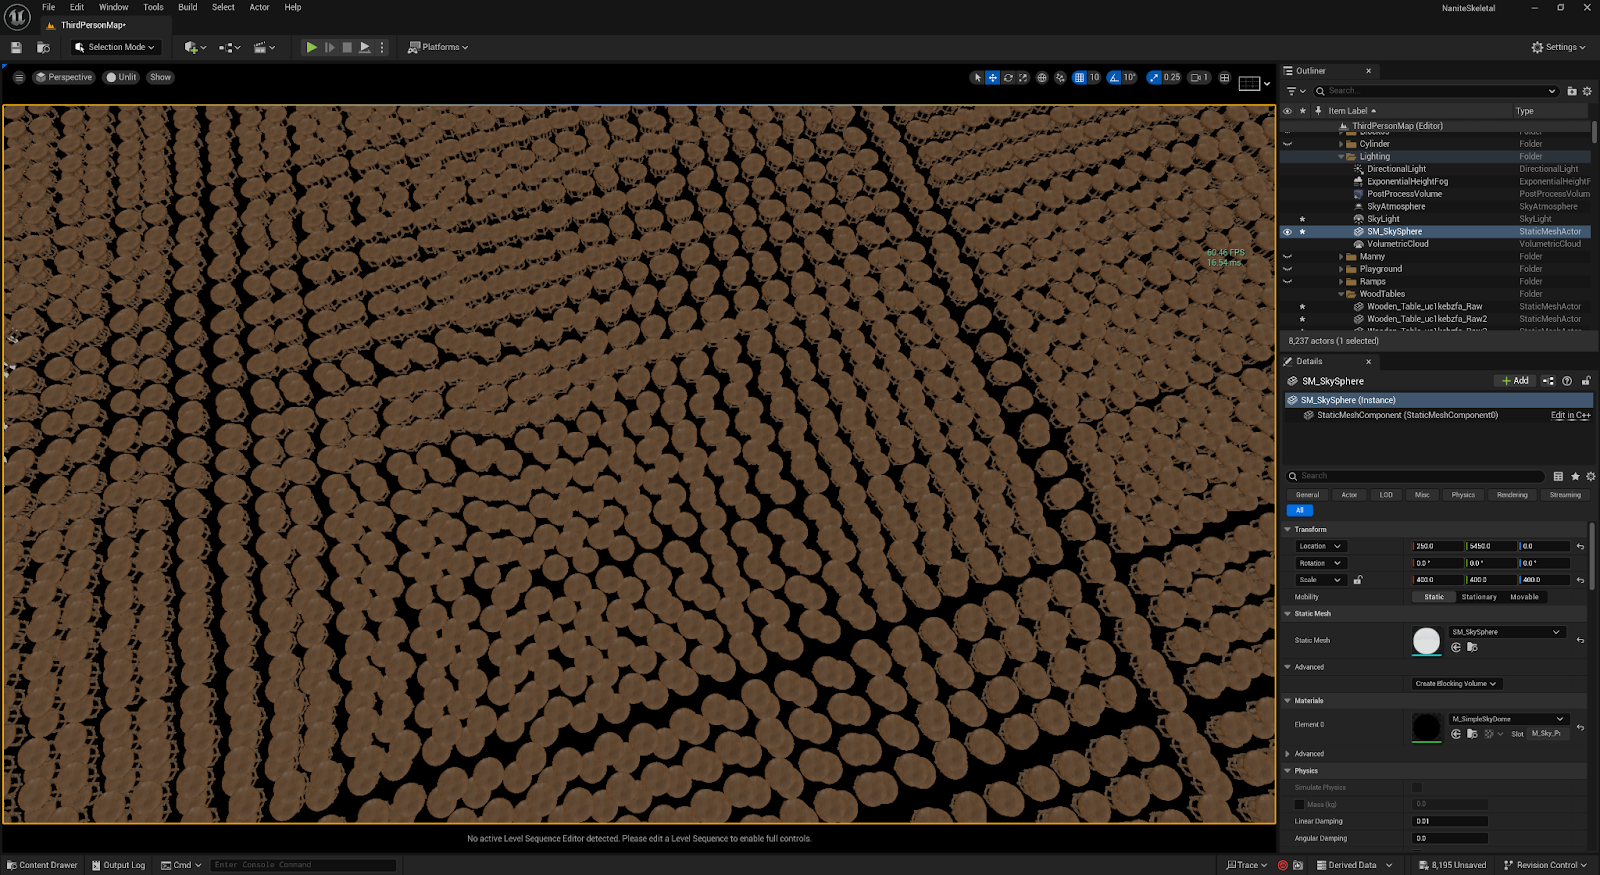
Nanite: Test images
Table contains Nanite data
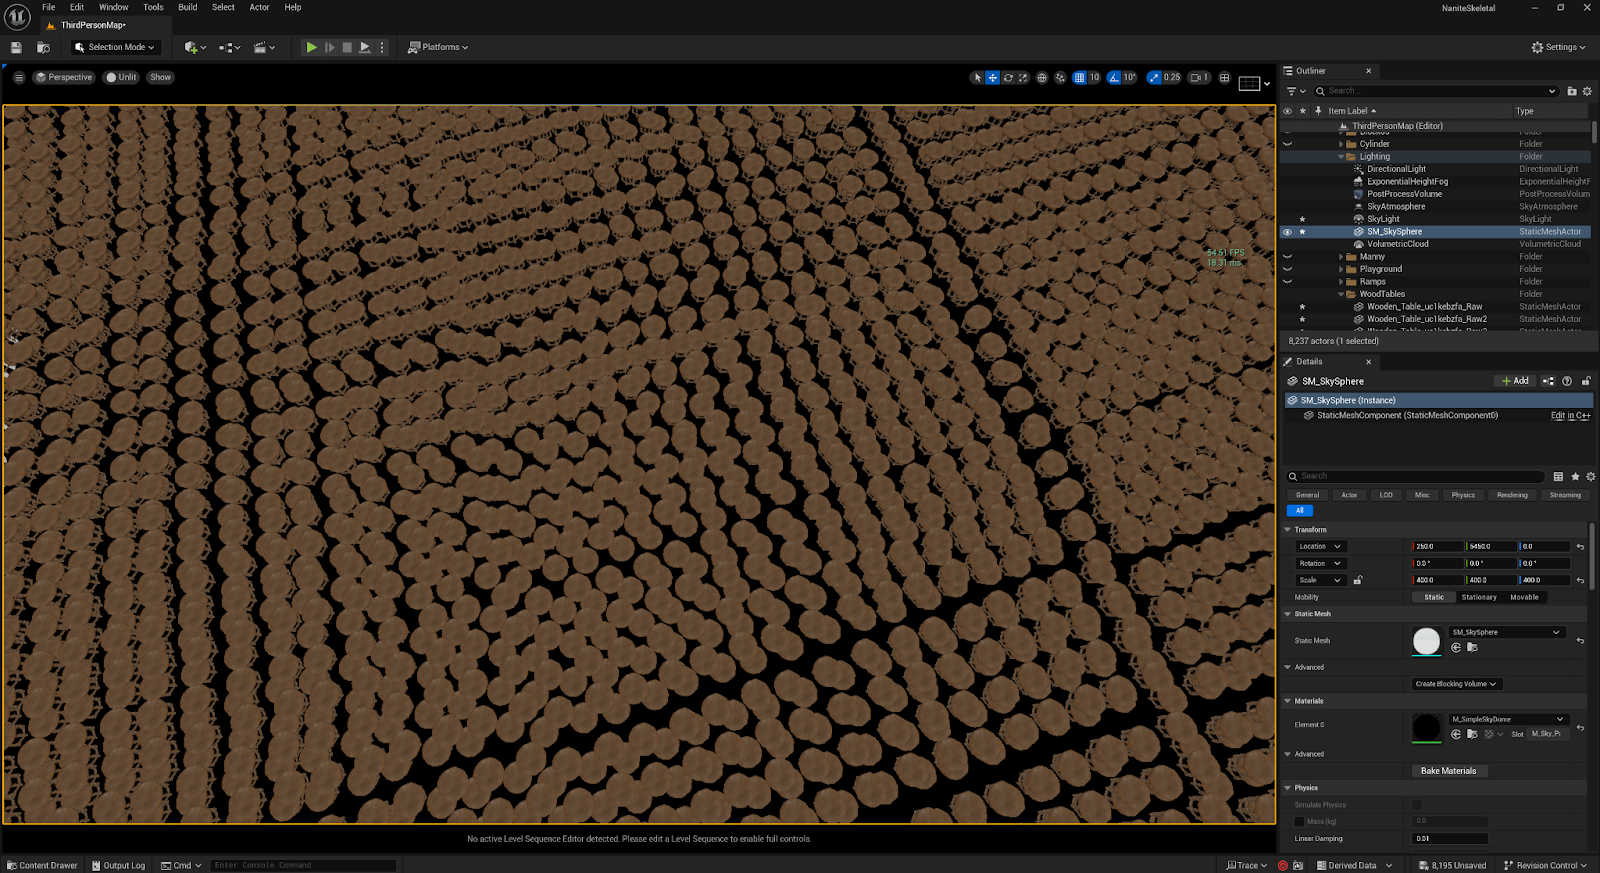
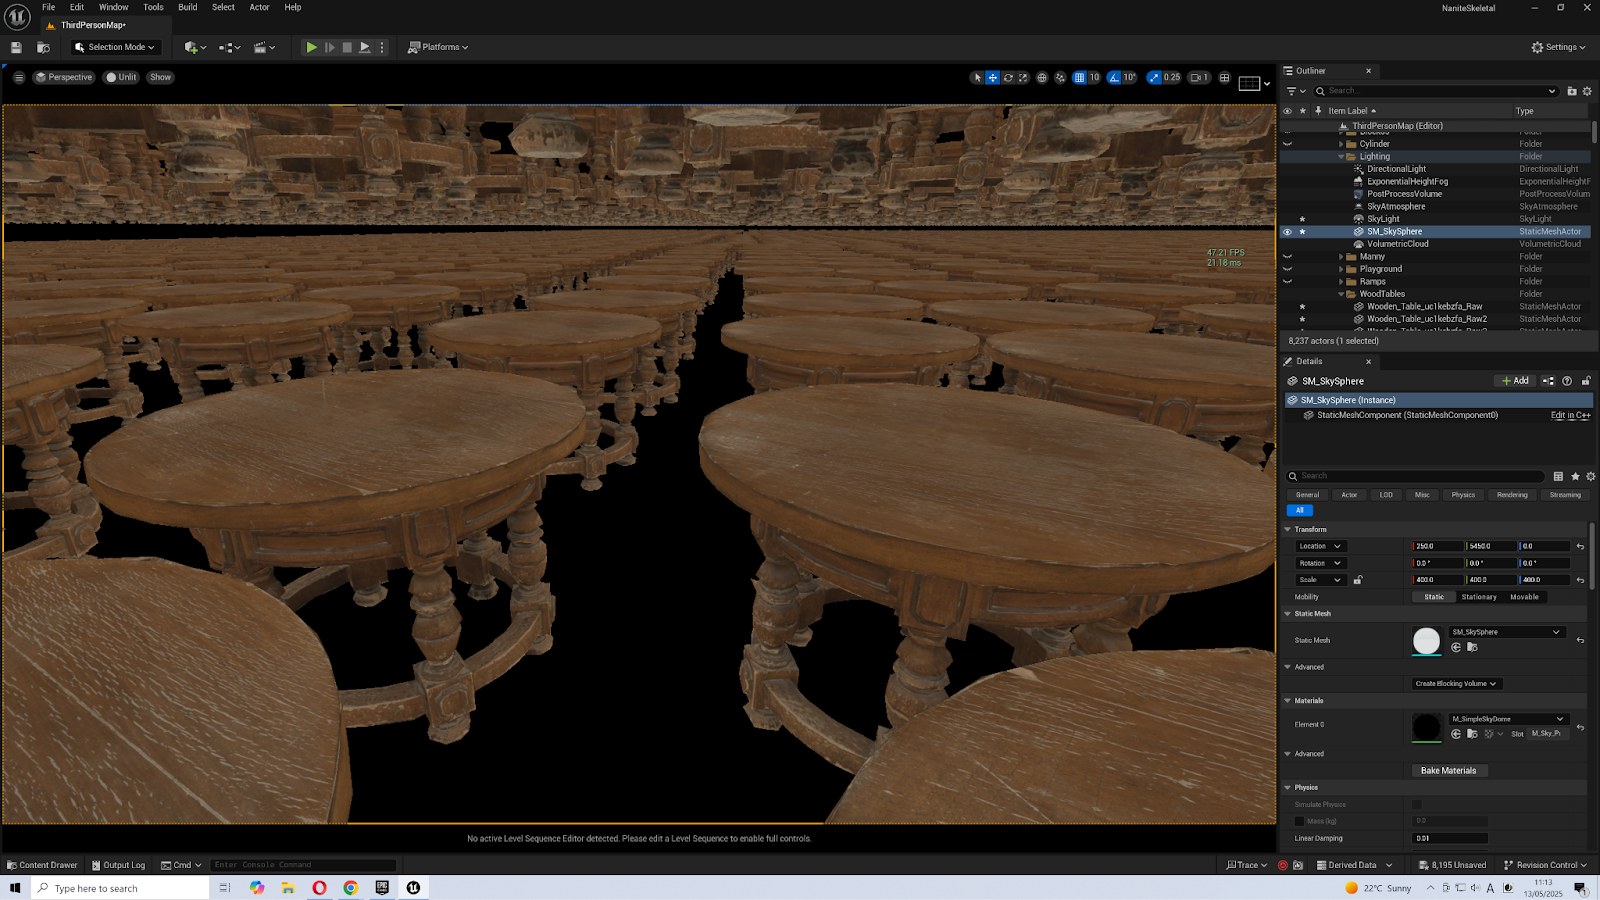
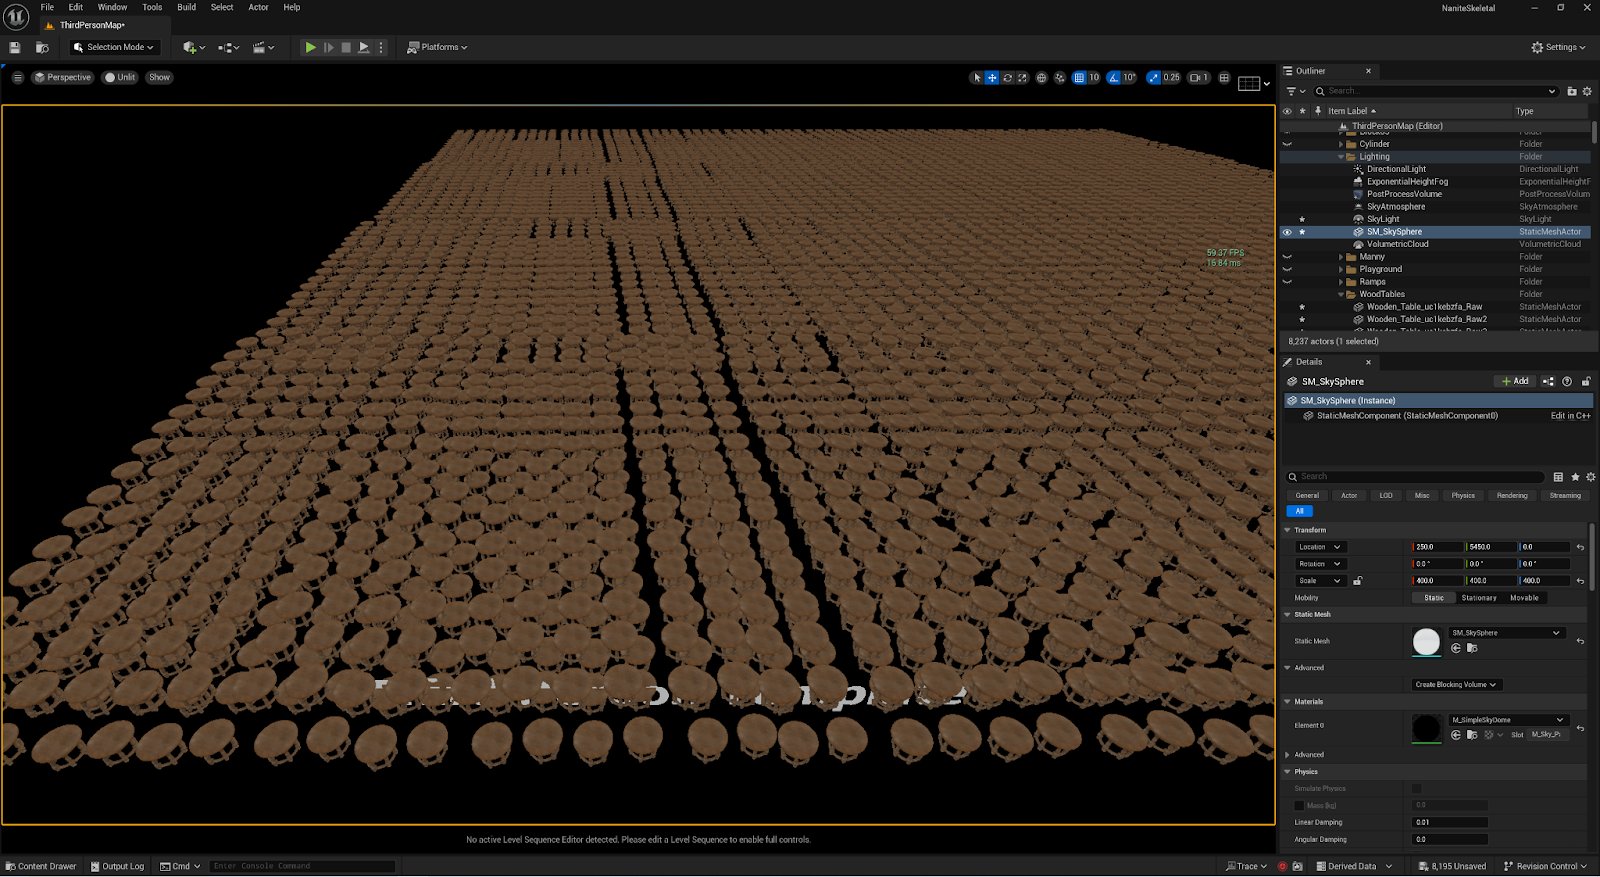
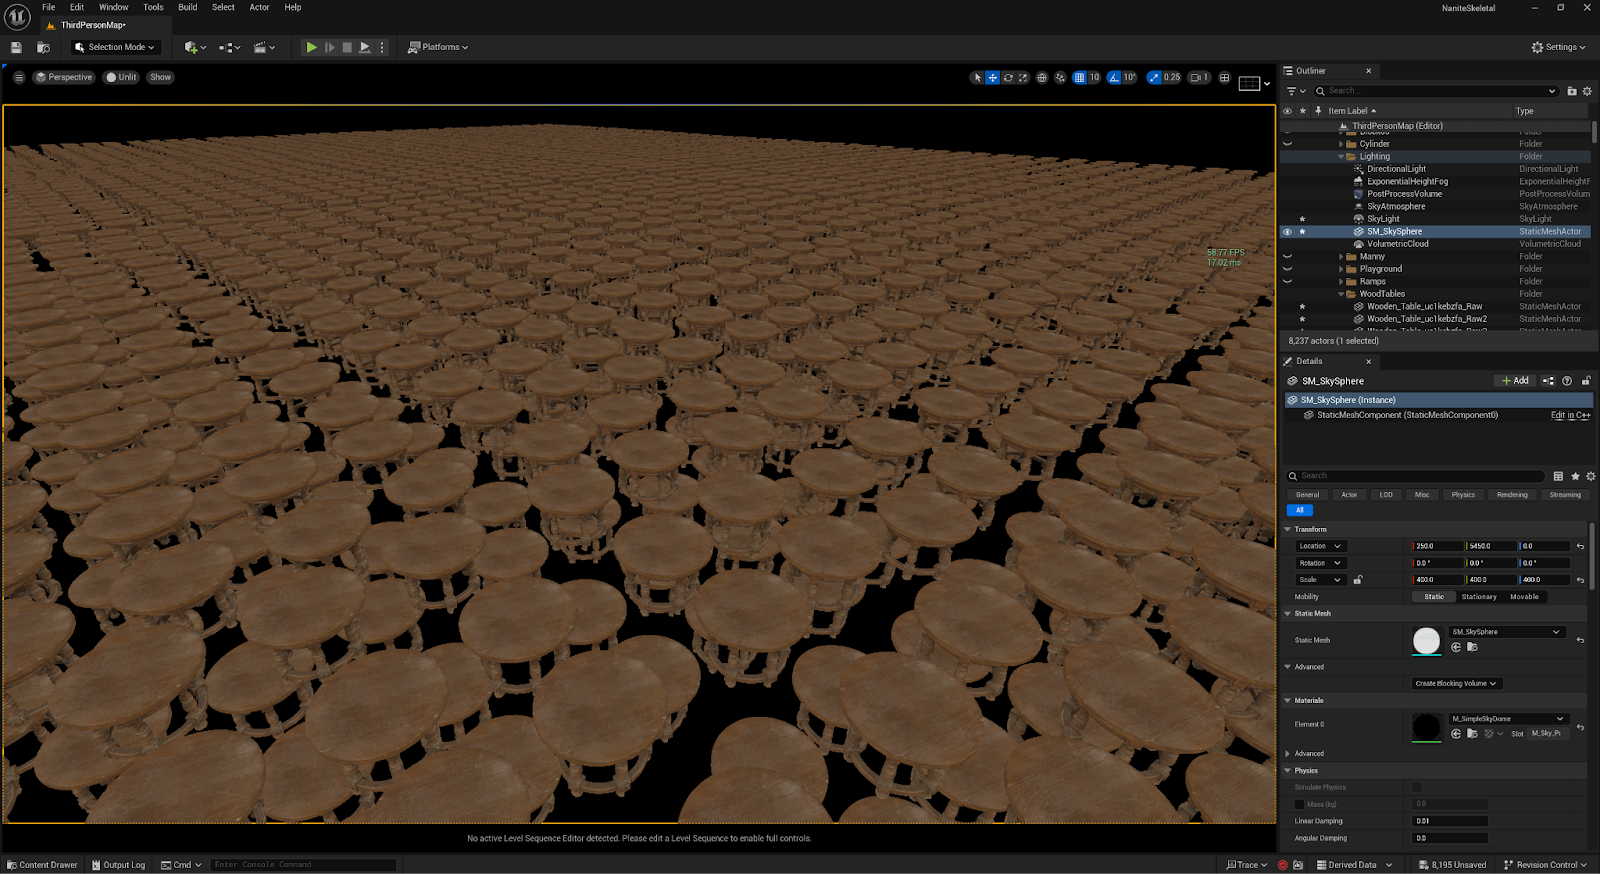
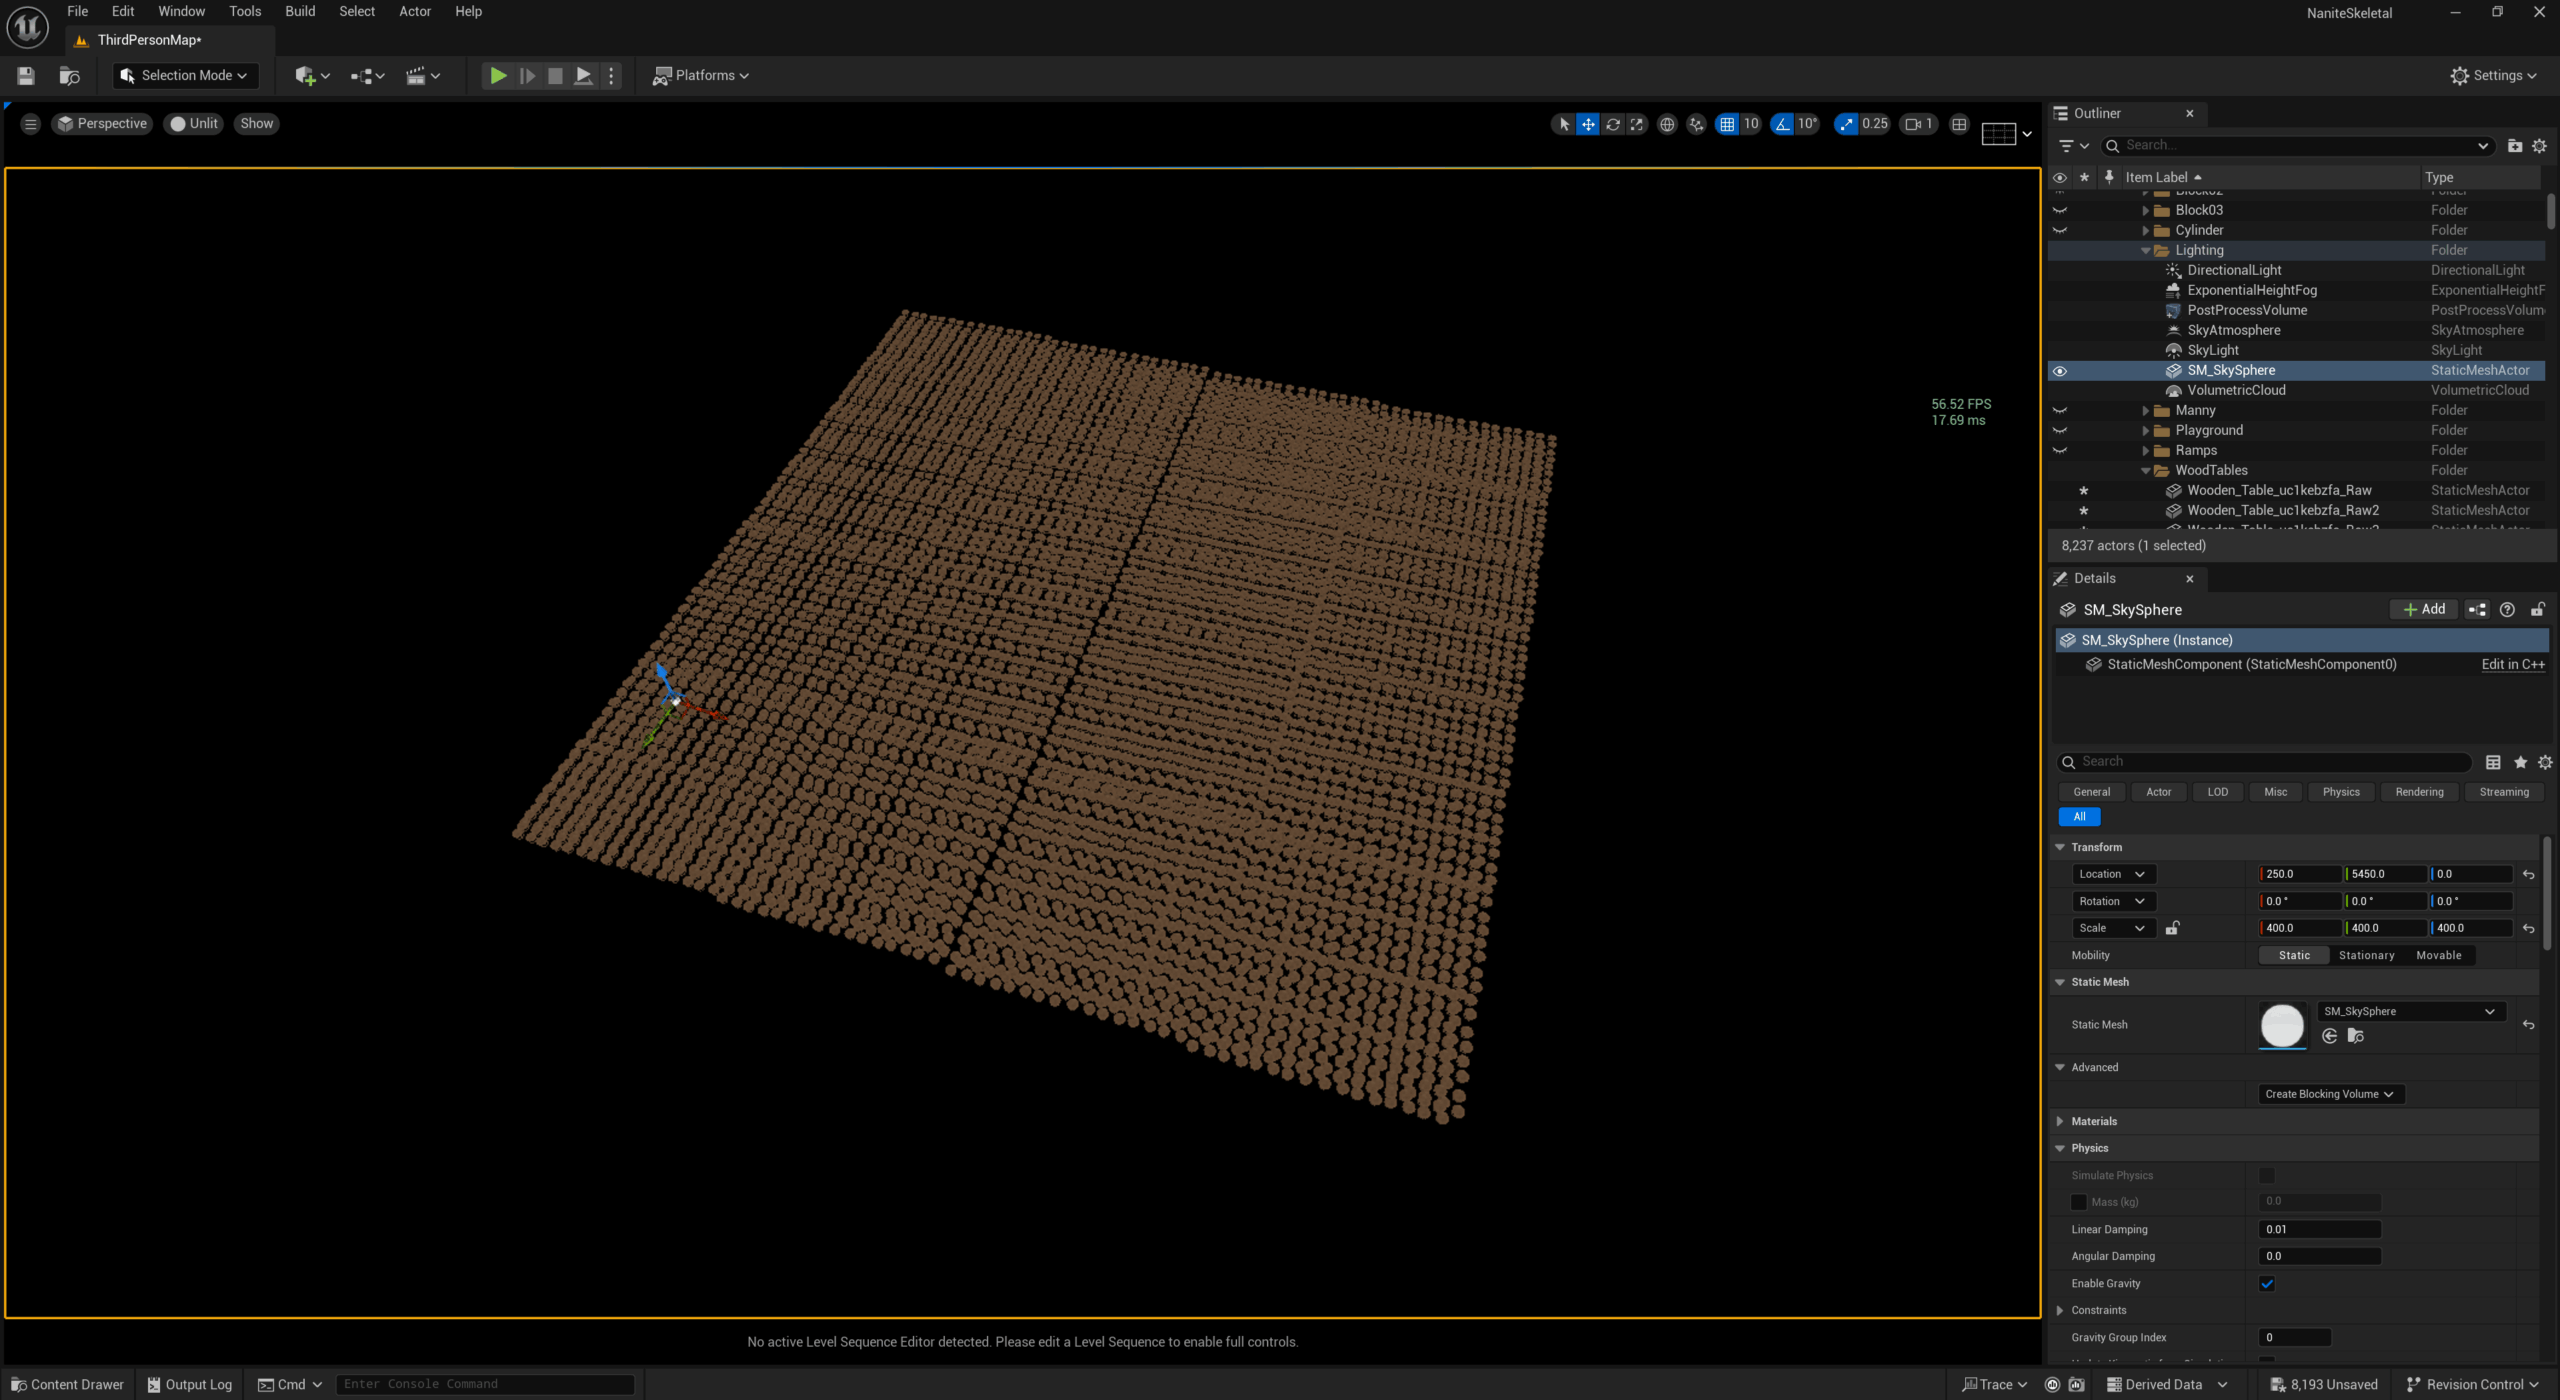
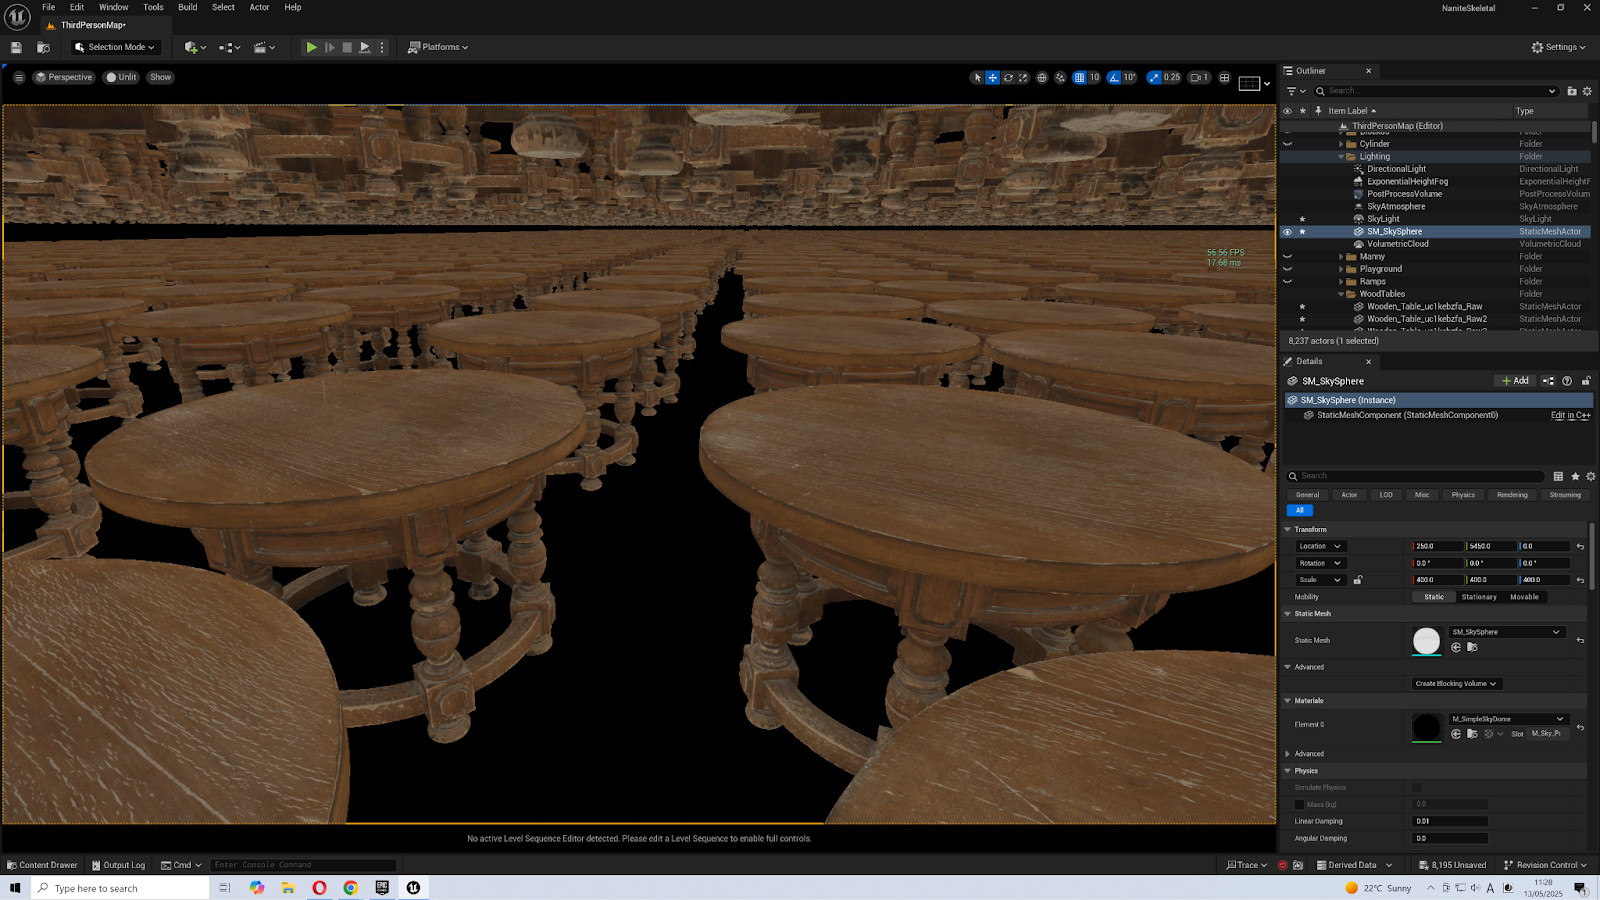 |  |
| Bookmark0, ~60fp | |
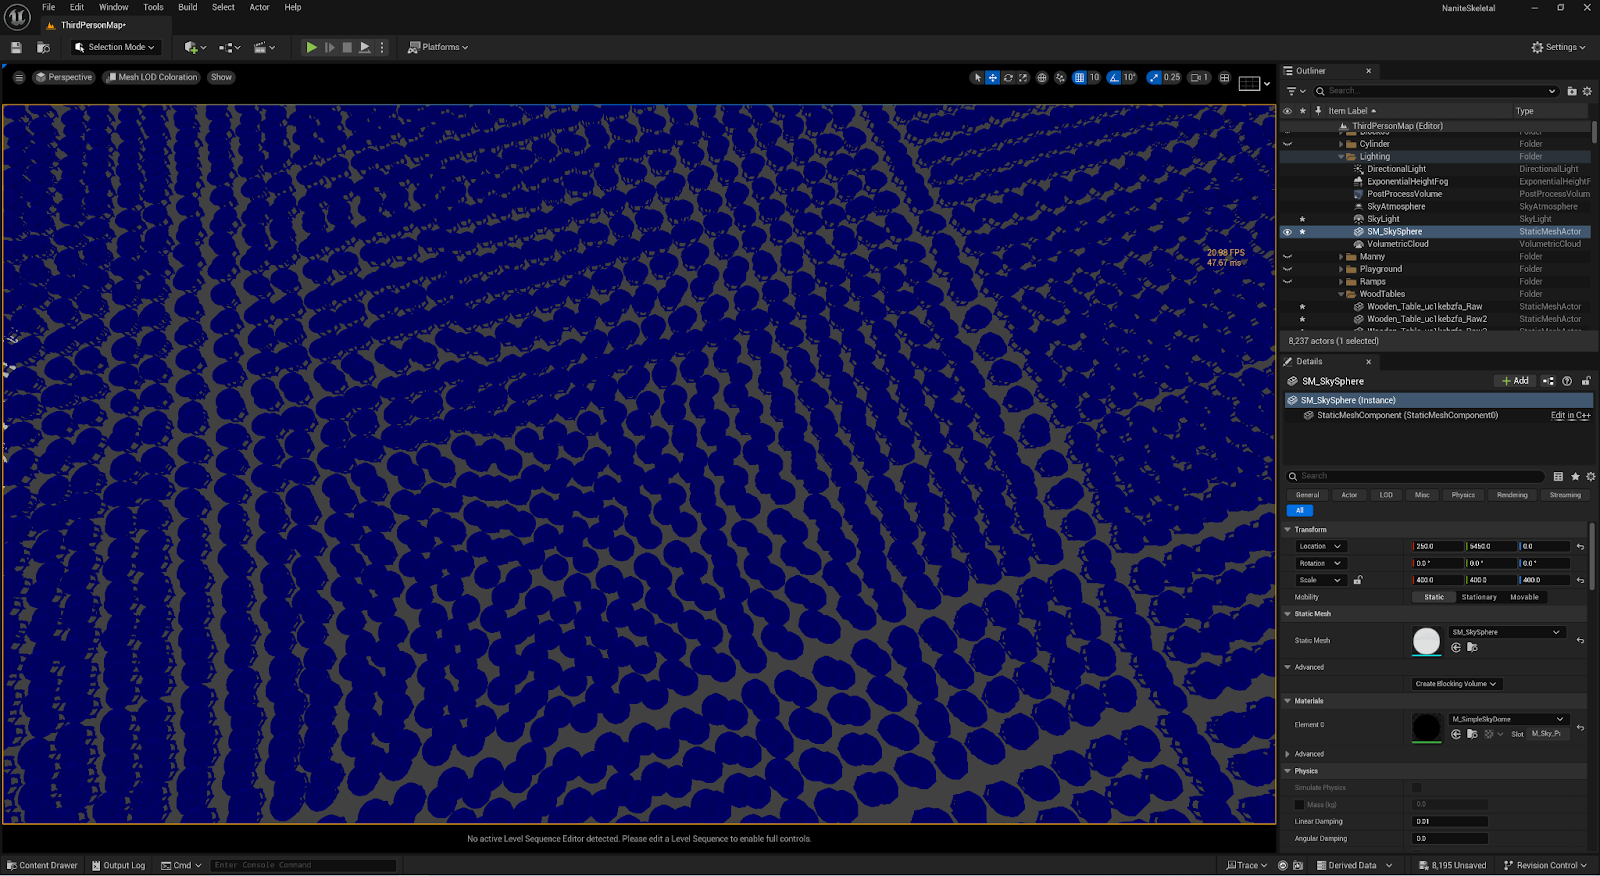
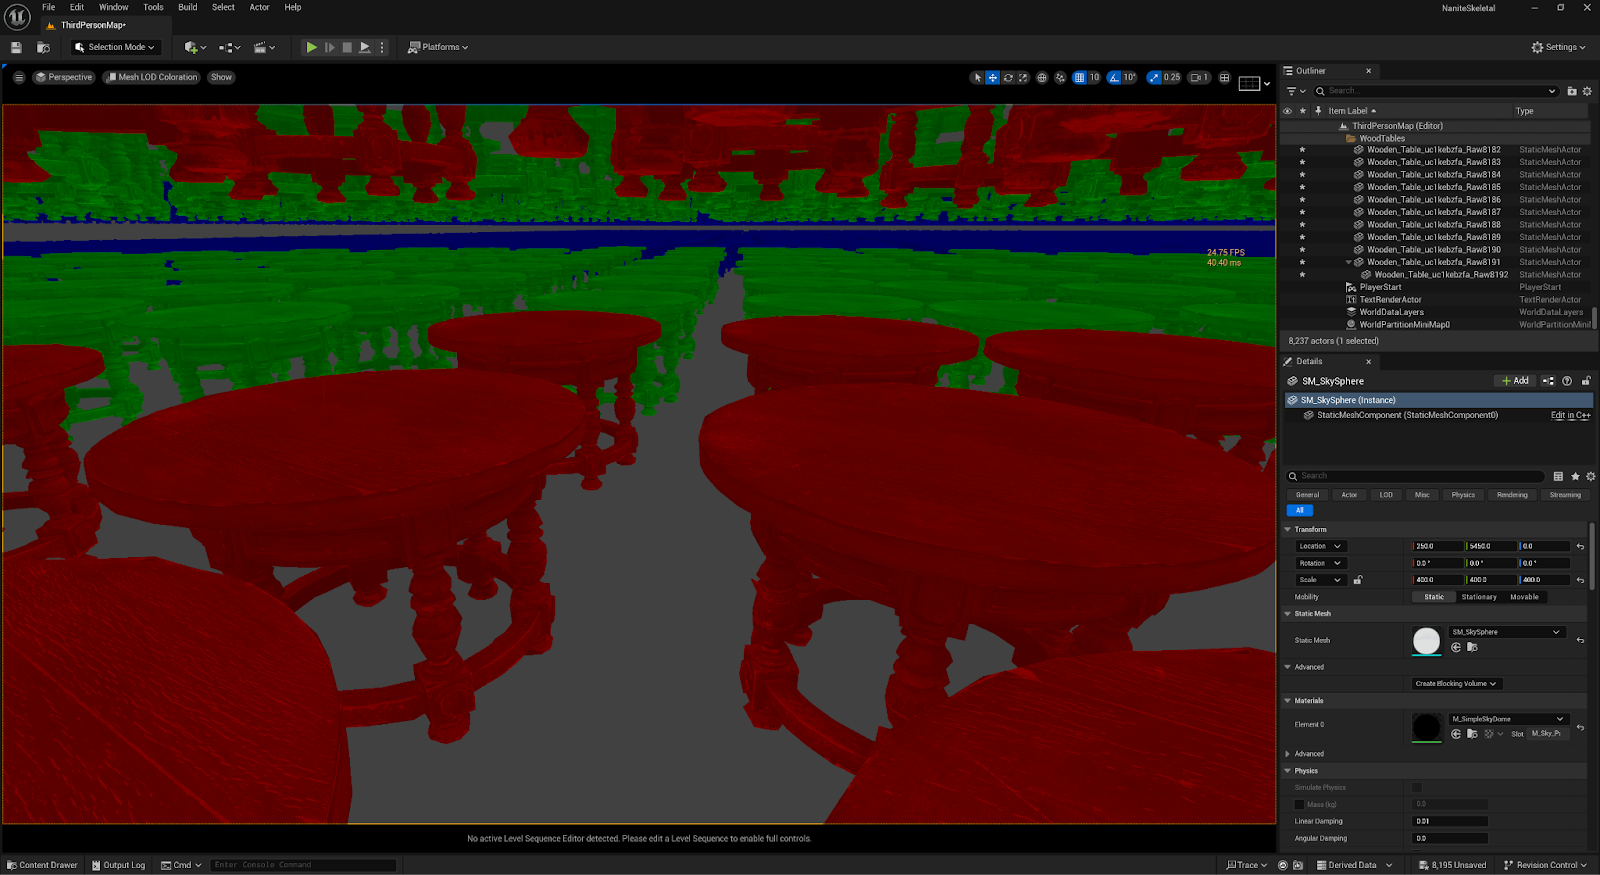
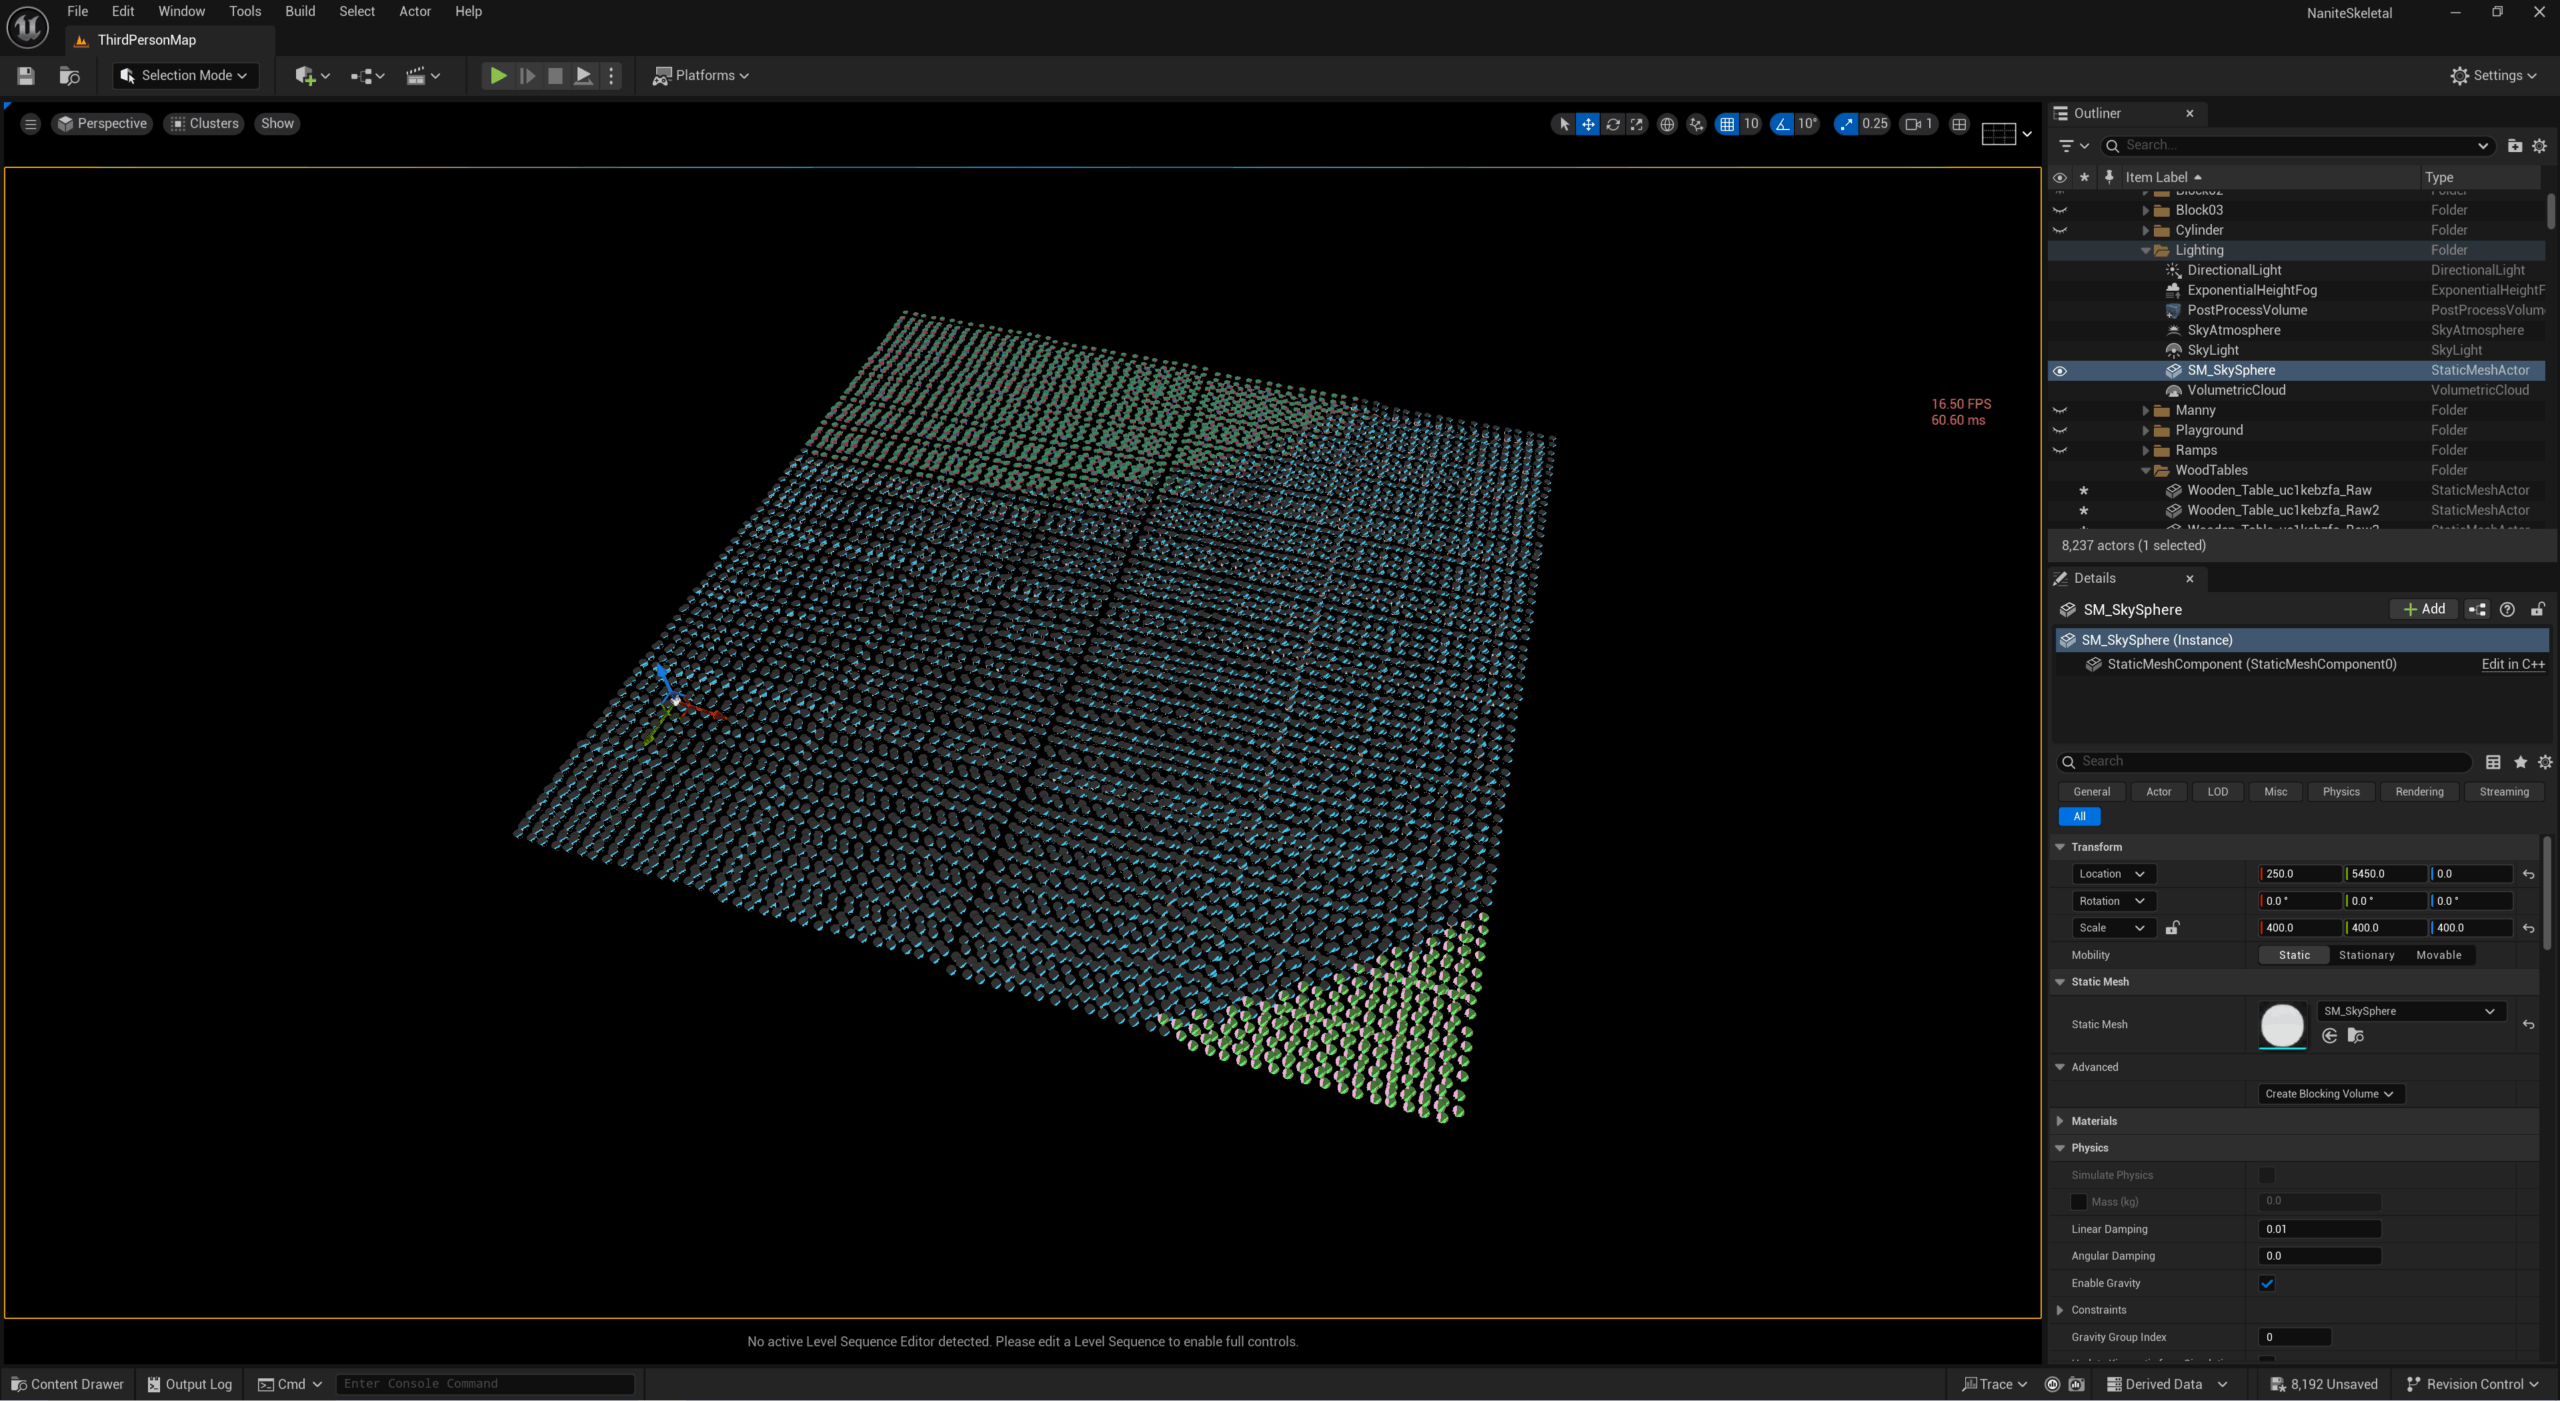
 |  |
| Bookmark1, ~60 FPS | |
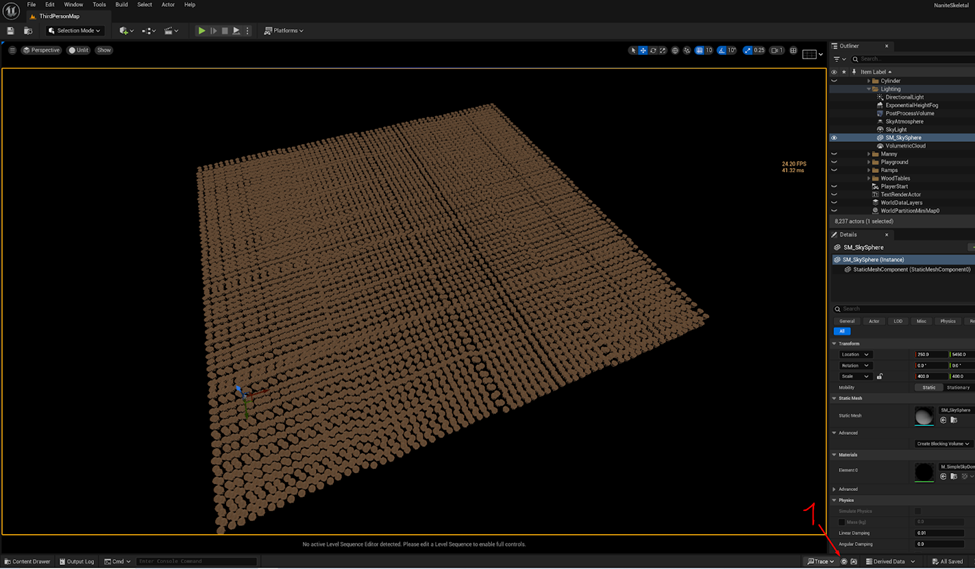
 |  |
| Bookmark3, ~60FPS | |
 |  |
| Bookmark5, ~ 60 FPS | |
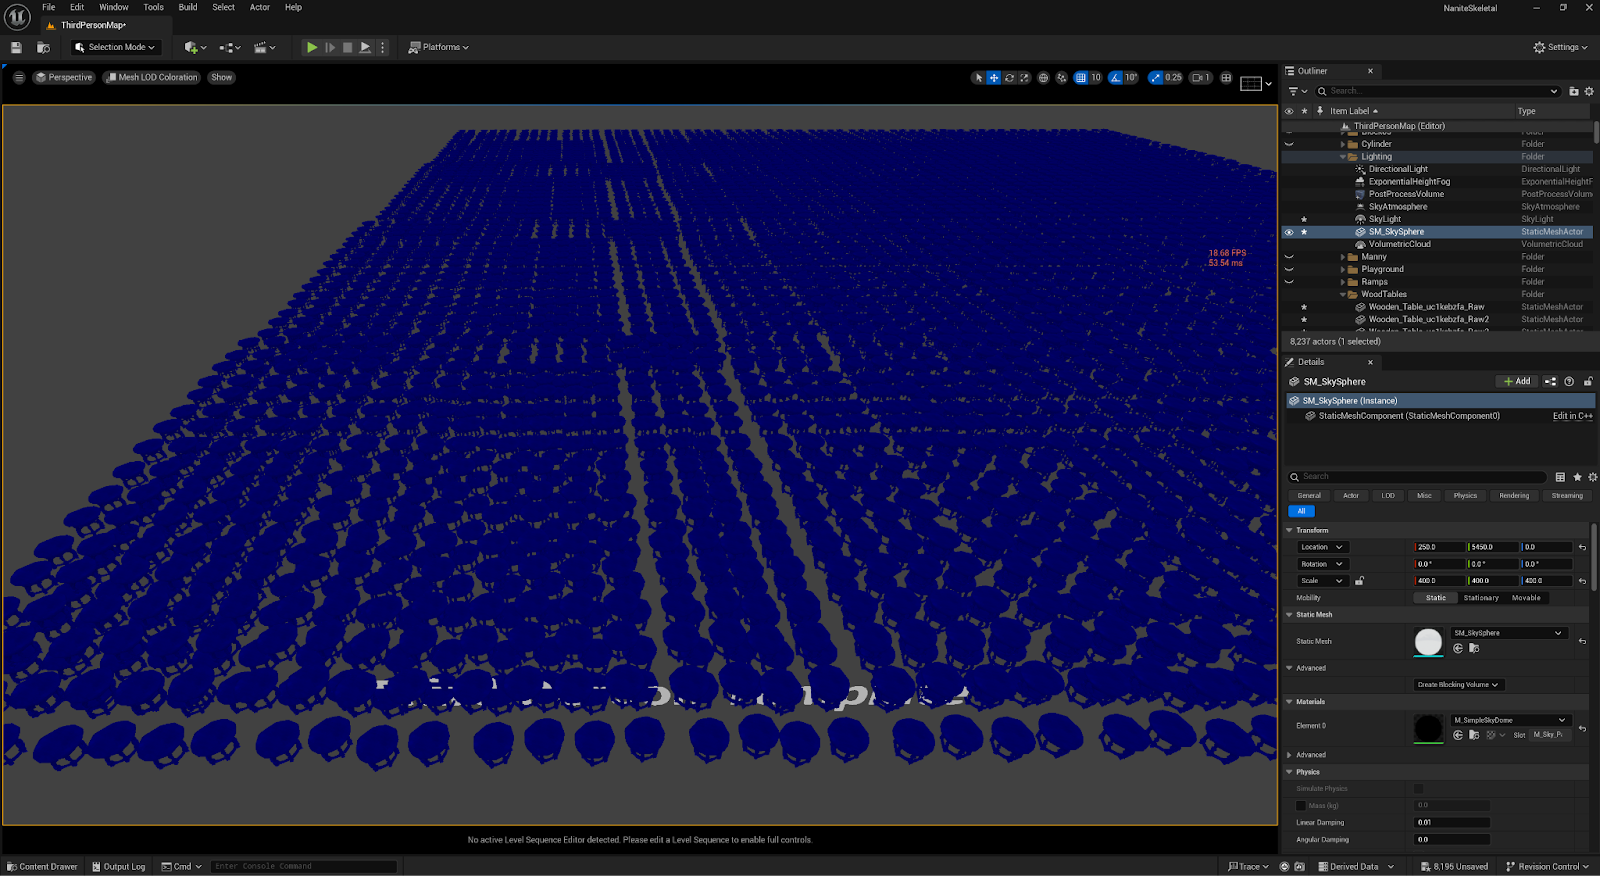
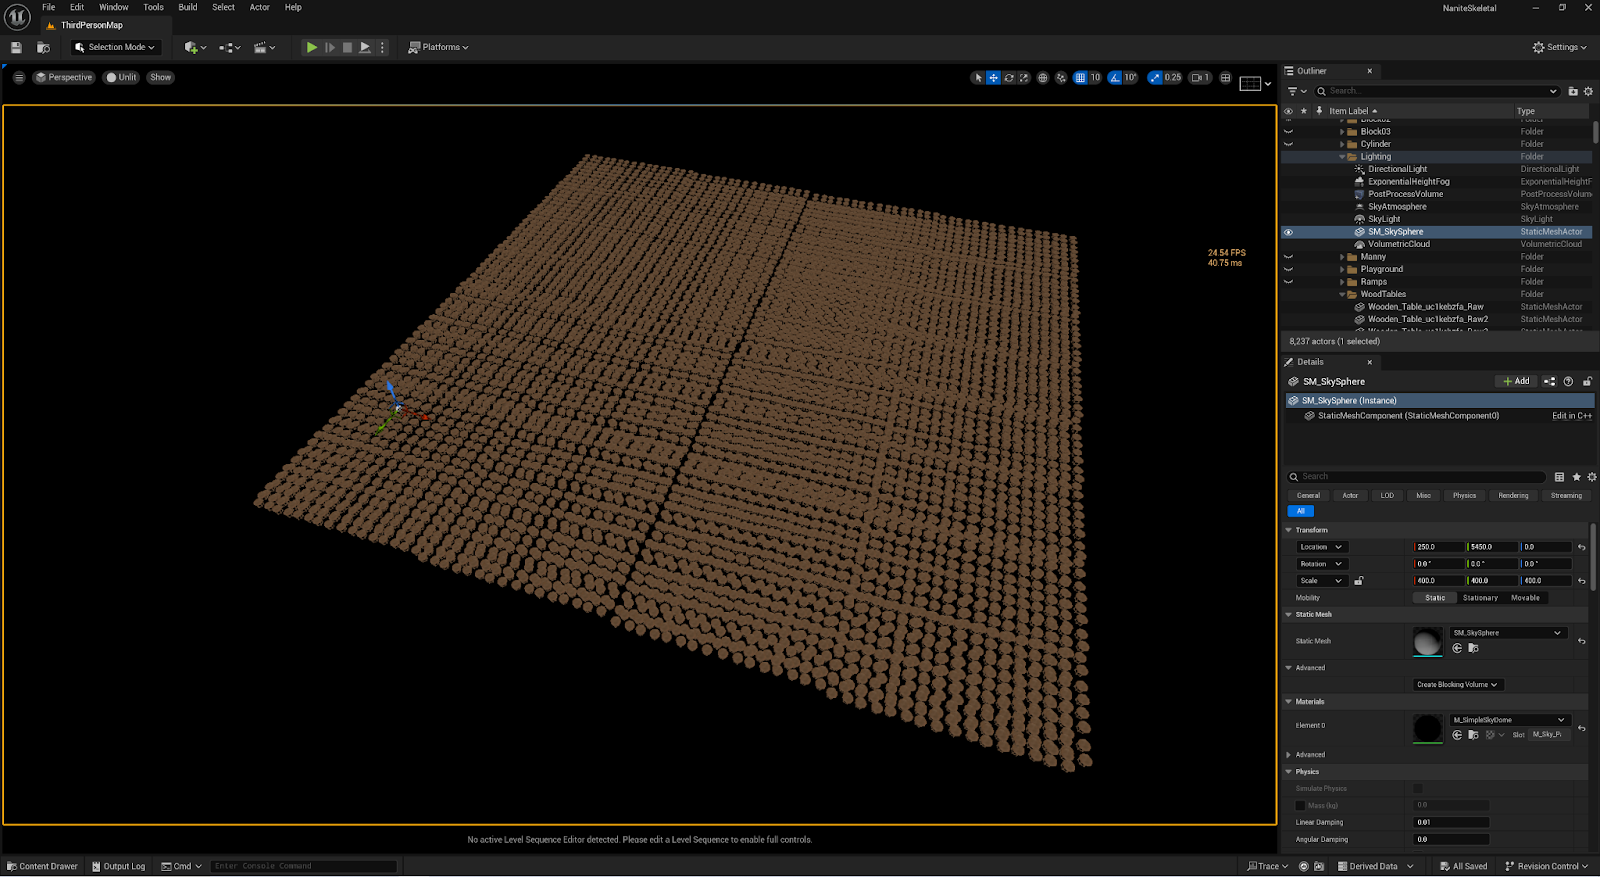
 |  |
| Bookmark9, 55-58FPS | |
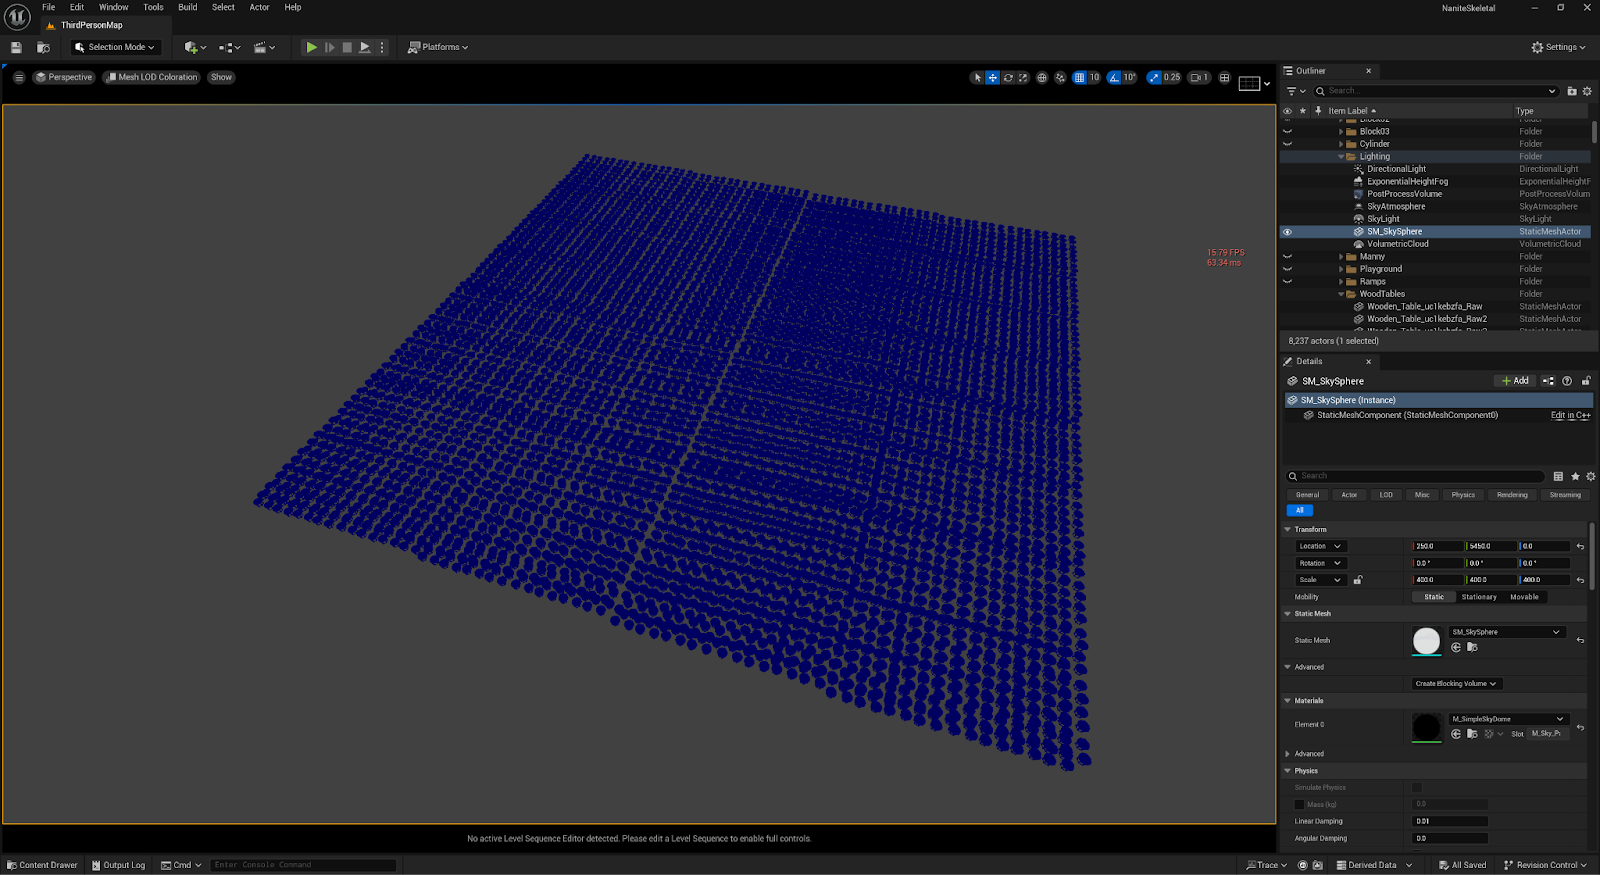
 |  |
| Nanite handles this situation well — 8192 instances and still holding at 60 FPS. |
So Why the Discrepancy?
Despite closely matching levels of geometry, the LOD versiondropped to 24 FPS at extreme range. Nanite holds steady at 60 FPS across all conditions. Let’s investigate why. We analysed this using a Trace capture — a file that logs every scheduled task and render event during gameplay. To make this manageable, we used screenshots and bookmarks to jump directly to critical moments
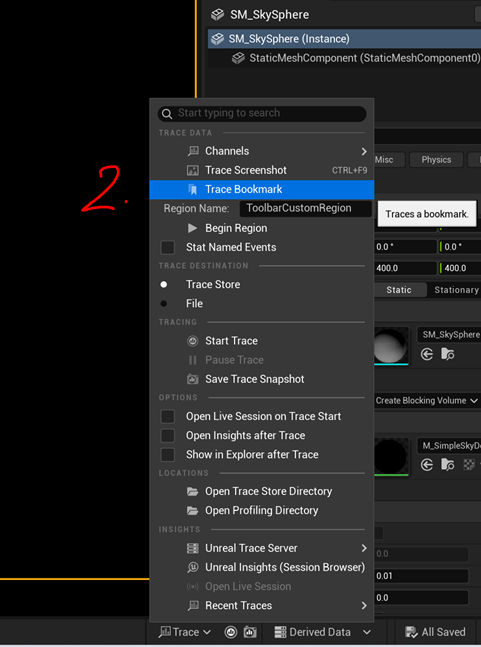
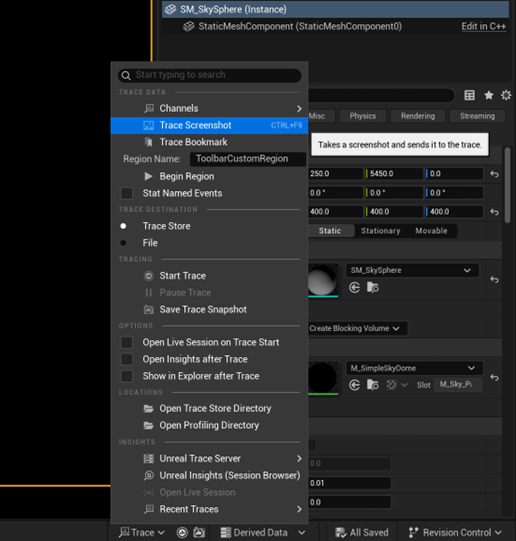
Creating a trace
- Start a new trace by clicking this icon. This will turn the icon red, and the trace will begin.
- Now from the menu add a Bookmark and or take a Screenshot of the game at the bottleneck so you can see it in the Unreal insight window.
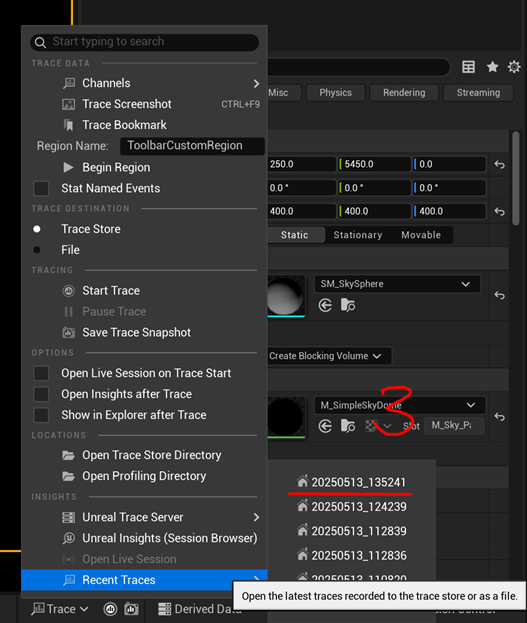
- Stop the trace by pressing trace button again and open the latest trace in Unreal insight.
Unreal Insights – Trace Analysis
To confirm, we captured a full trace of both scenarios and used bookmarks/screenshots to align visual states with CPU timelines.
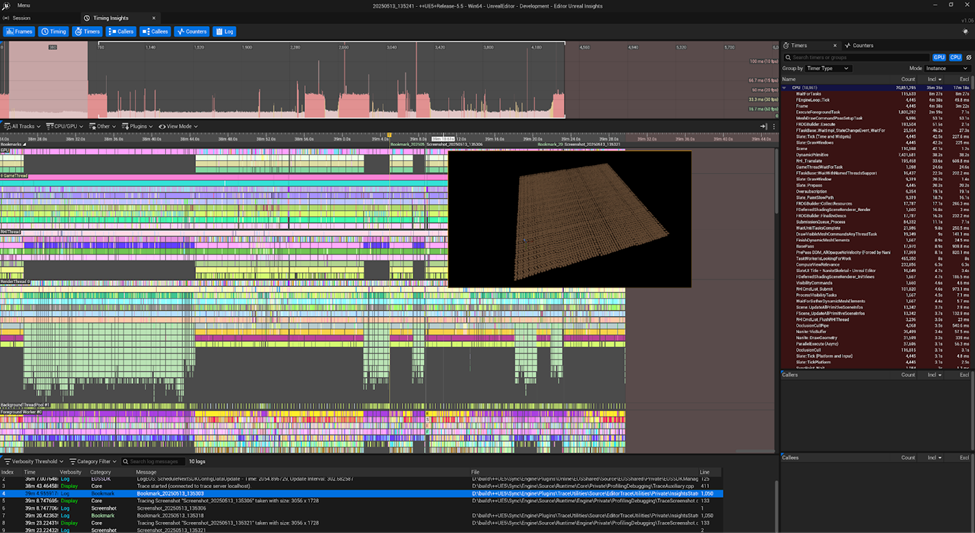
Double clicking on a bookmark or screenshot in the log section will bring you to the place in the trace that you bookmarked or screenshot. Here you can zoom into a frame and find what is taking the most time.
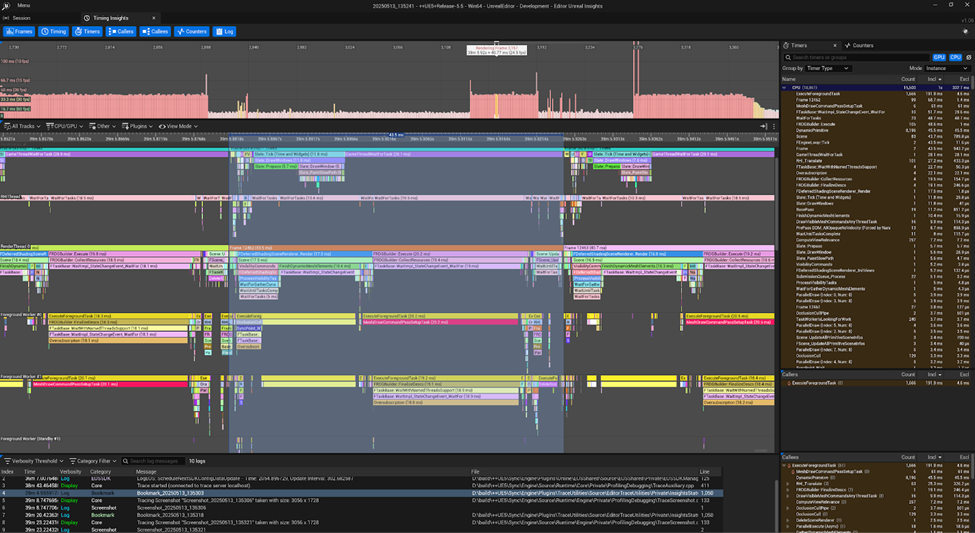
Isolating frame 3,157 we can see that the frame time is 42.4ms
CPU Timeline Analysis:
- MeshDrawCommandPassSetupTask dominates the frame. With nearly 60 ms of CPU time is spent on:
- Preparing draw commands
LOD visibility evaluation
Culling and bounding checks
- Actor-to-scene proxy setup
- Preparing draw commands
Meanwhile, the GPU is underutilized and idling. This is a severe bottle neck for the GPU.
Unreal Insight, interpretation:
Traditional LOD rendering:
- Involves per-object setup logic even at low LOD levels
- Scales linearly with actor count
- Suffers a sharp performance cliff around ~8K actors depending on CPU
- The number of draw calls being the limiting factor
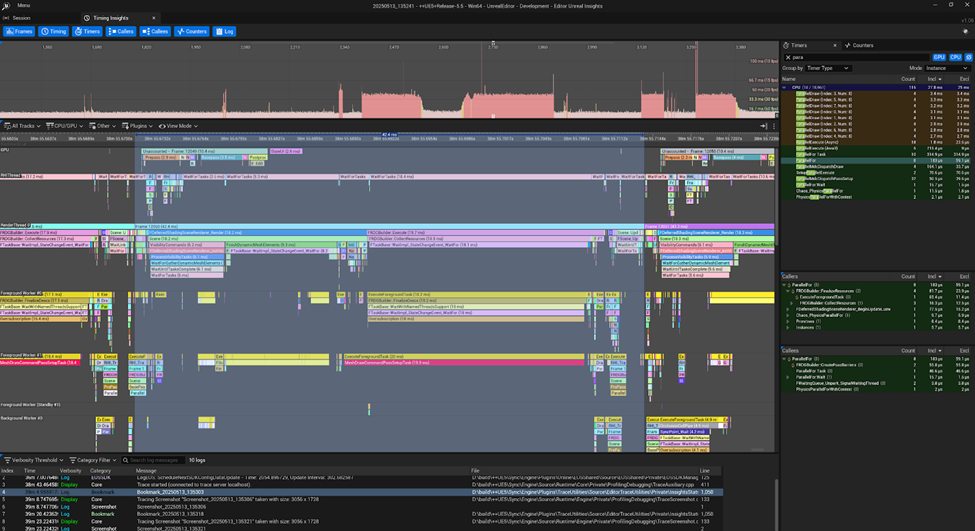
Nanite:
- Nanite uses cluster-based geometry streaming. Only visible portions of meshes are kept in GPU memory, allowing efficient rendering of high-poly assets.
- Performs cluster swapping and culling on the GPU based on camera view and connectivity
- Bypasses most CPU-side draw command setup
- Maintains nearly flat setup cost regardless of actor count
Why Draw Calls Matter
Every actor with a traditional LOD must go through CPU-side setup: transform updates, culling checks, LOD evaluation, and draw call generation. With thousands of actors, this becomes a bottleneck — even if they render with minimal triangles. Nanite skips this entire process by treating geometry as GPU-managed clusters.
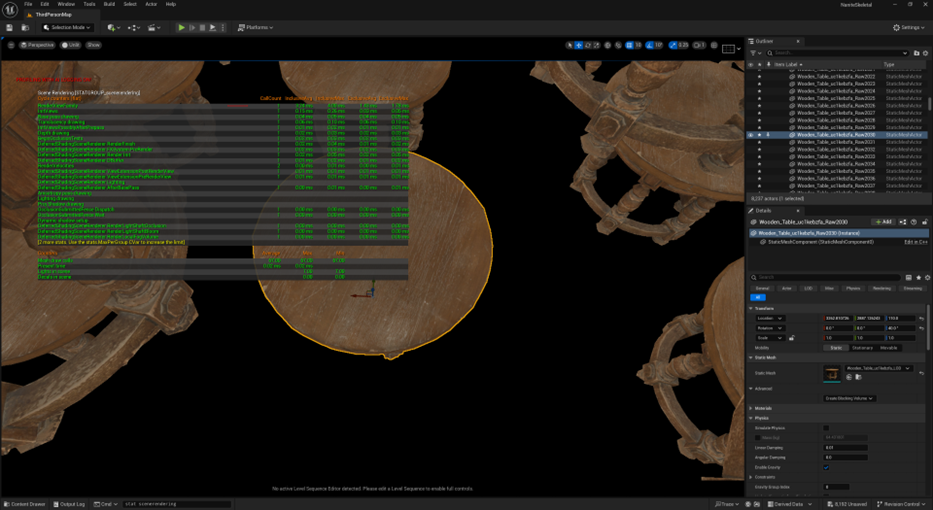
To get an idea of what MeshDrawCommandPassSetupTask roughlydoes we can look at the‘stat scenerendering’ from the command prompt. Which gives statistical view like this image.
After taking several points at varying distances from the camera and graphing the data, we get this result.
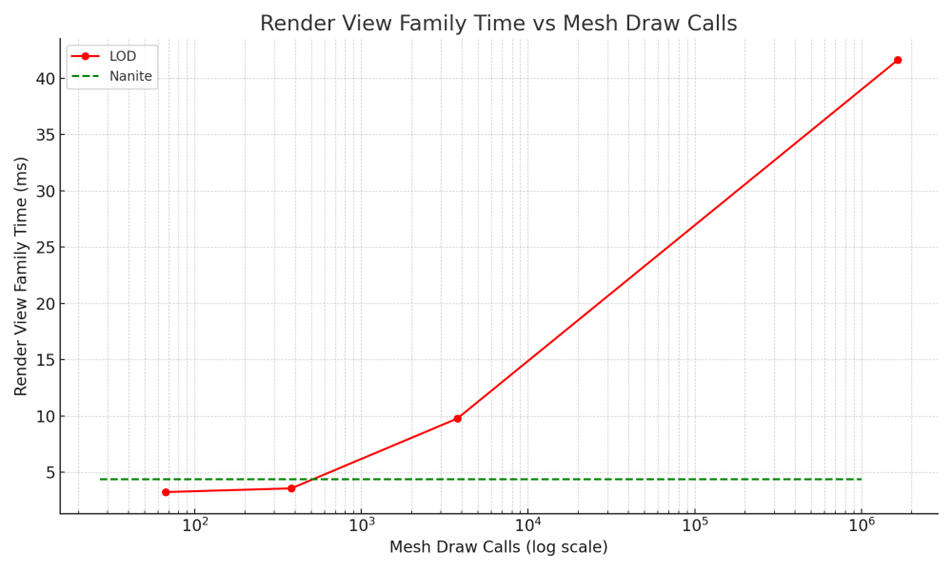
(Chart generated from stat scenerendering command.)
Graph Notes:
- X-axis: Mesh draw calls (log scale)
- Y-axis: Render View Family Time in ms
- Red line = LOD (increasing draw calls)
- Green dashed line = Nanite (flat, consistent)
Conclusion:
Nanite excels not just because it handles more triangles — but because it eliminates the CPU bottlenecks of LOD-based rendering.
At large instance counts, the cost of draw setup and per-actor visibility management outweighs LOD triangle savings.
Once this threshold is crossed, Nanite’s unified draw model and GPU culling allow it to maintain high performance where LODs fail. On aging hardware, it managed to do very well. On more modern setup I am sure that the results may not be so different.
Takeaway:
If you’re dealing with high object counts, even with low poly meshes:
Switching to Nanite may give dramatic performance improvements — not from GPU savings, but from sidestepping per-object CPU setup entirely.
This test illustrates where Nanite becomes more than a rendering feature — it’s a fundamental pipeline shift.
Next Steps: Skeletal Nanite and foliage
So we went through the process of setting up a model with Nanite and how to use auto LODs. We learned how to visualize the performance and pitfalls of Nanite, and traditional Static meshes using debug Overviews. And how to get debug numbers on where your models are having trouble. Using Insight and trace. Thank you for reading this far.
In Part 2, we’ll explore how Nanite performs with skeletal meshes and foliage — and whether its performance and flexibility can truly unify the rendering pipeline.
Keep exploring!
Addendum
Citations:
Source (1) https://dev.epicgames.com/documentation/en-us/unreal-engine/Nanite-virtualized-geometry-in-unreal-engine
Mega scan Table asset: https://fab.com/s/faa8872c30f4
Data
| Cmd ‘stat scenerendering’ | ||
| mesh drawcalls | Render view family | |
| LOD | ||
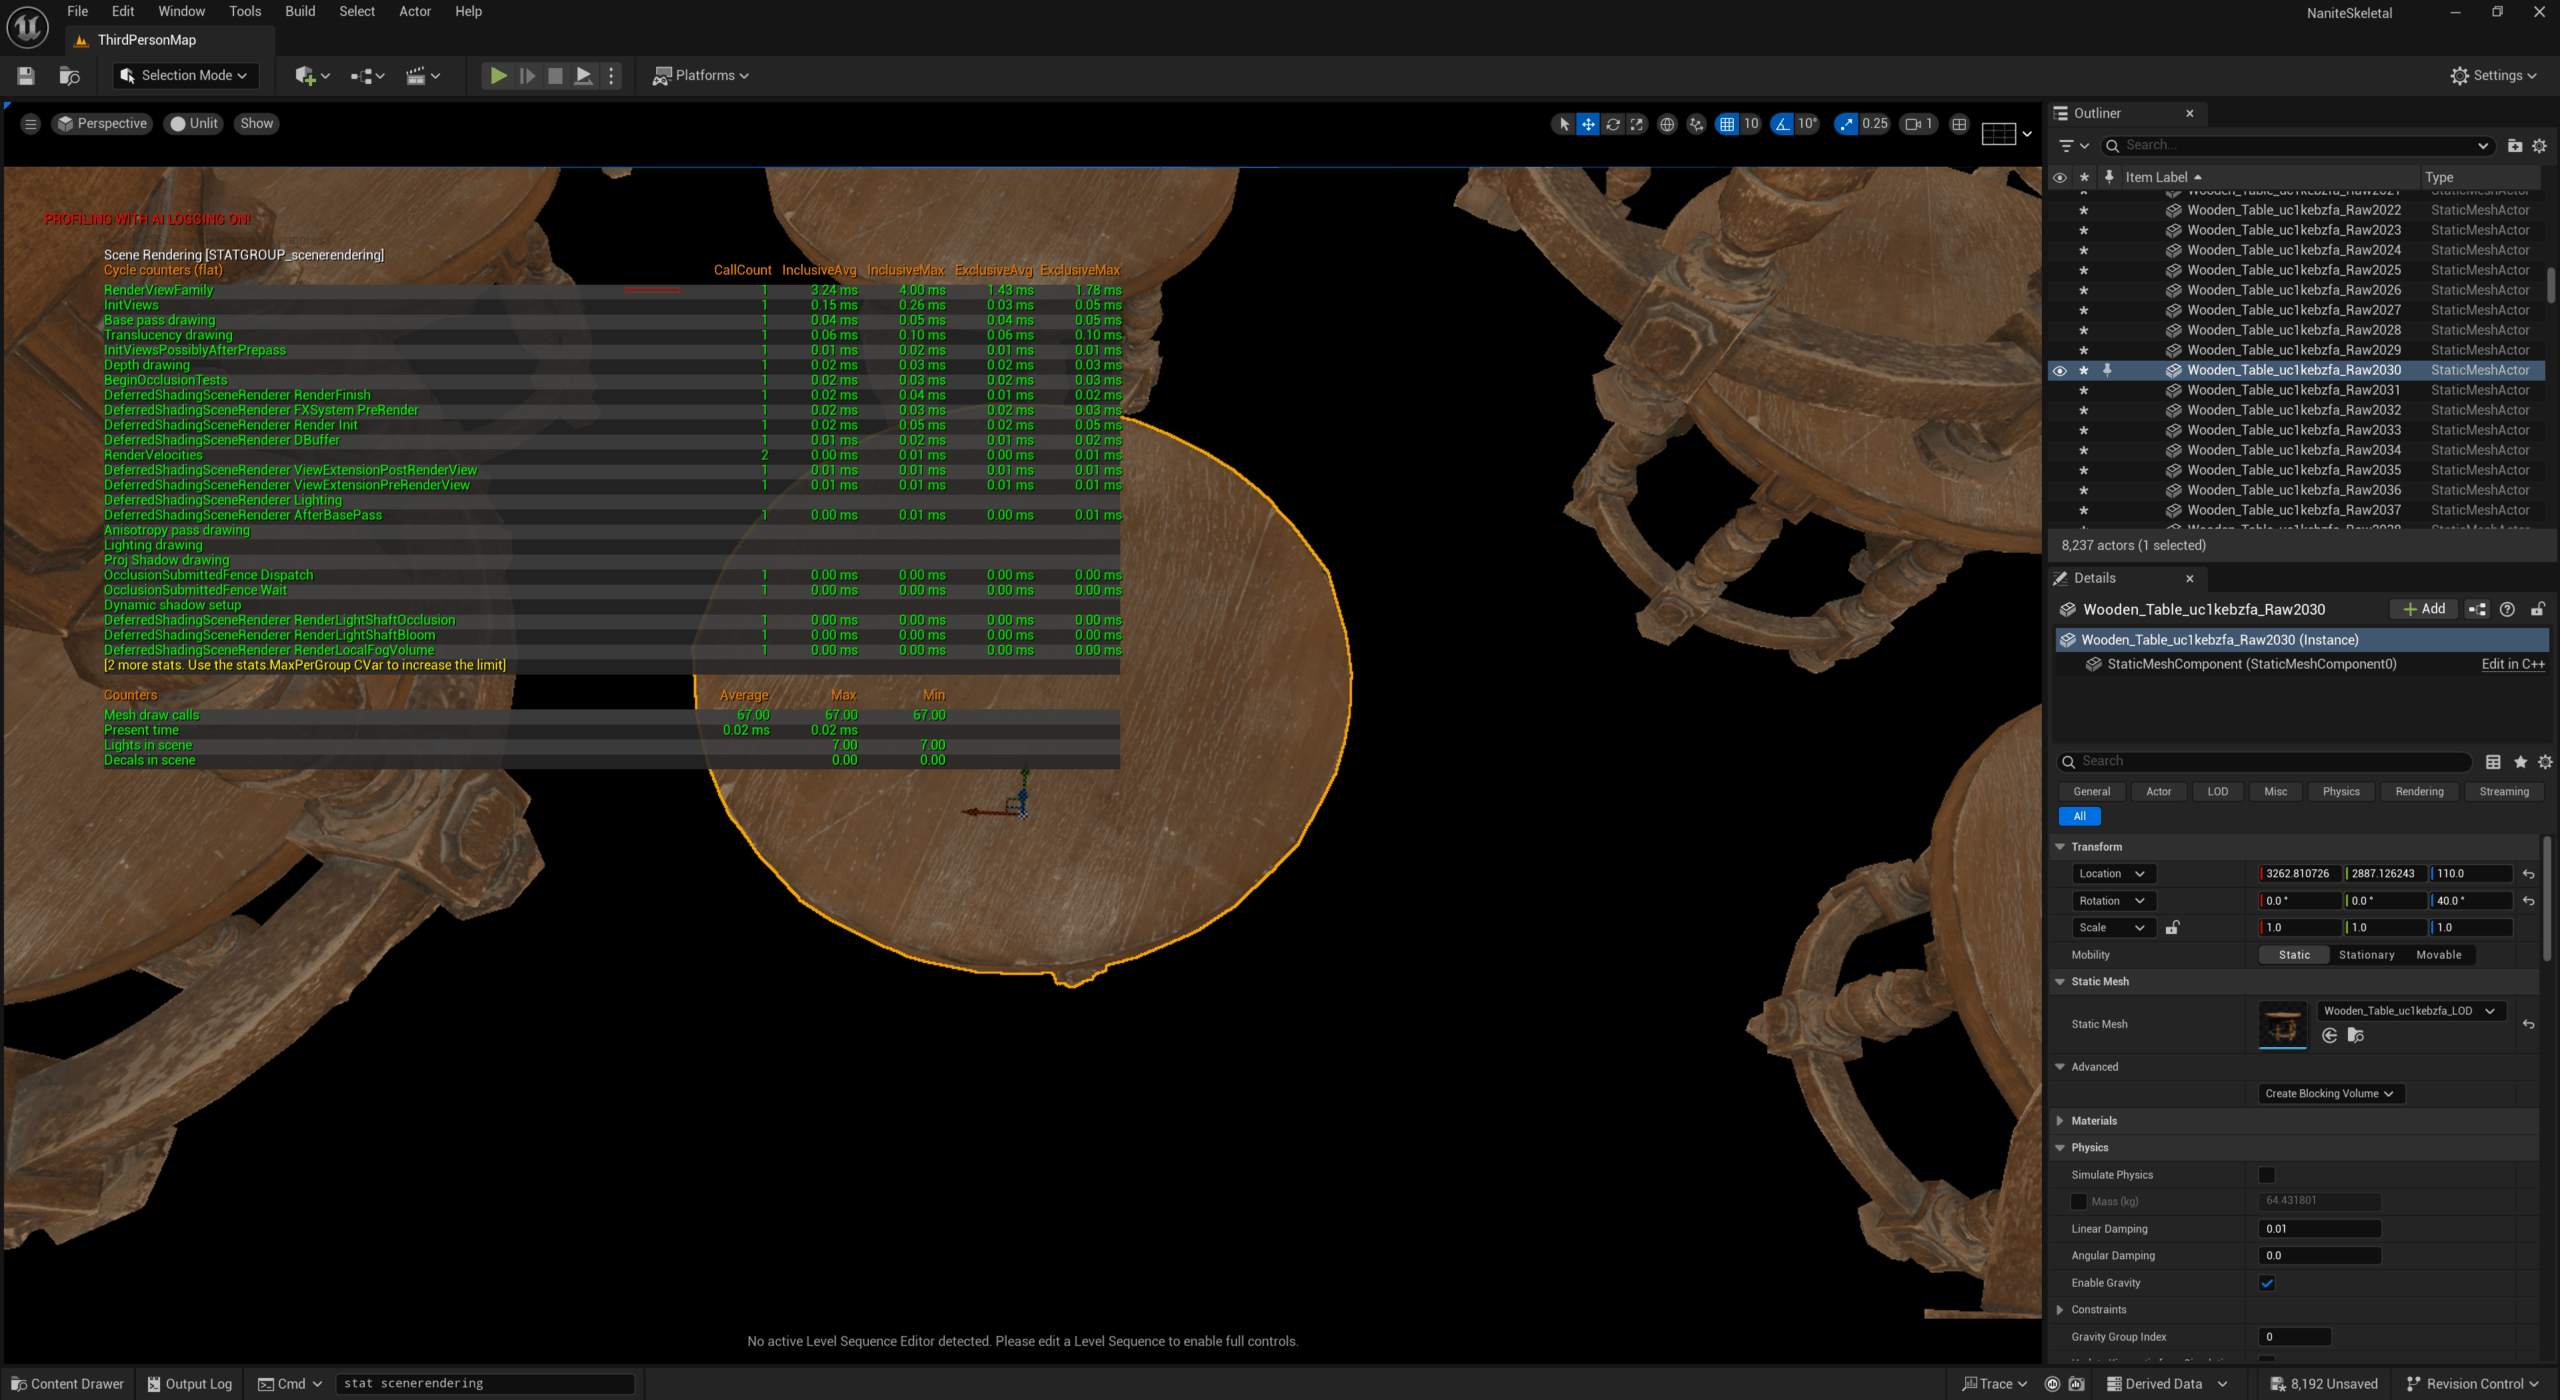 | 67 | 3.24ms |
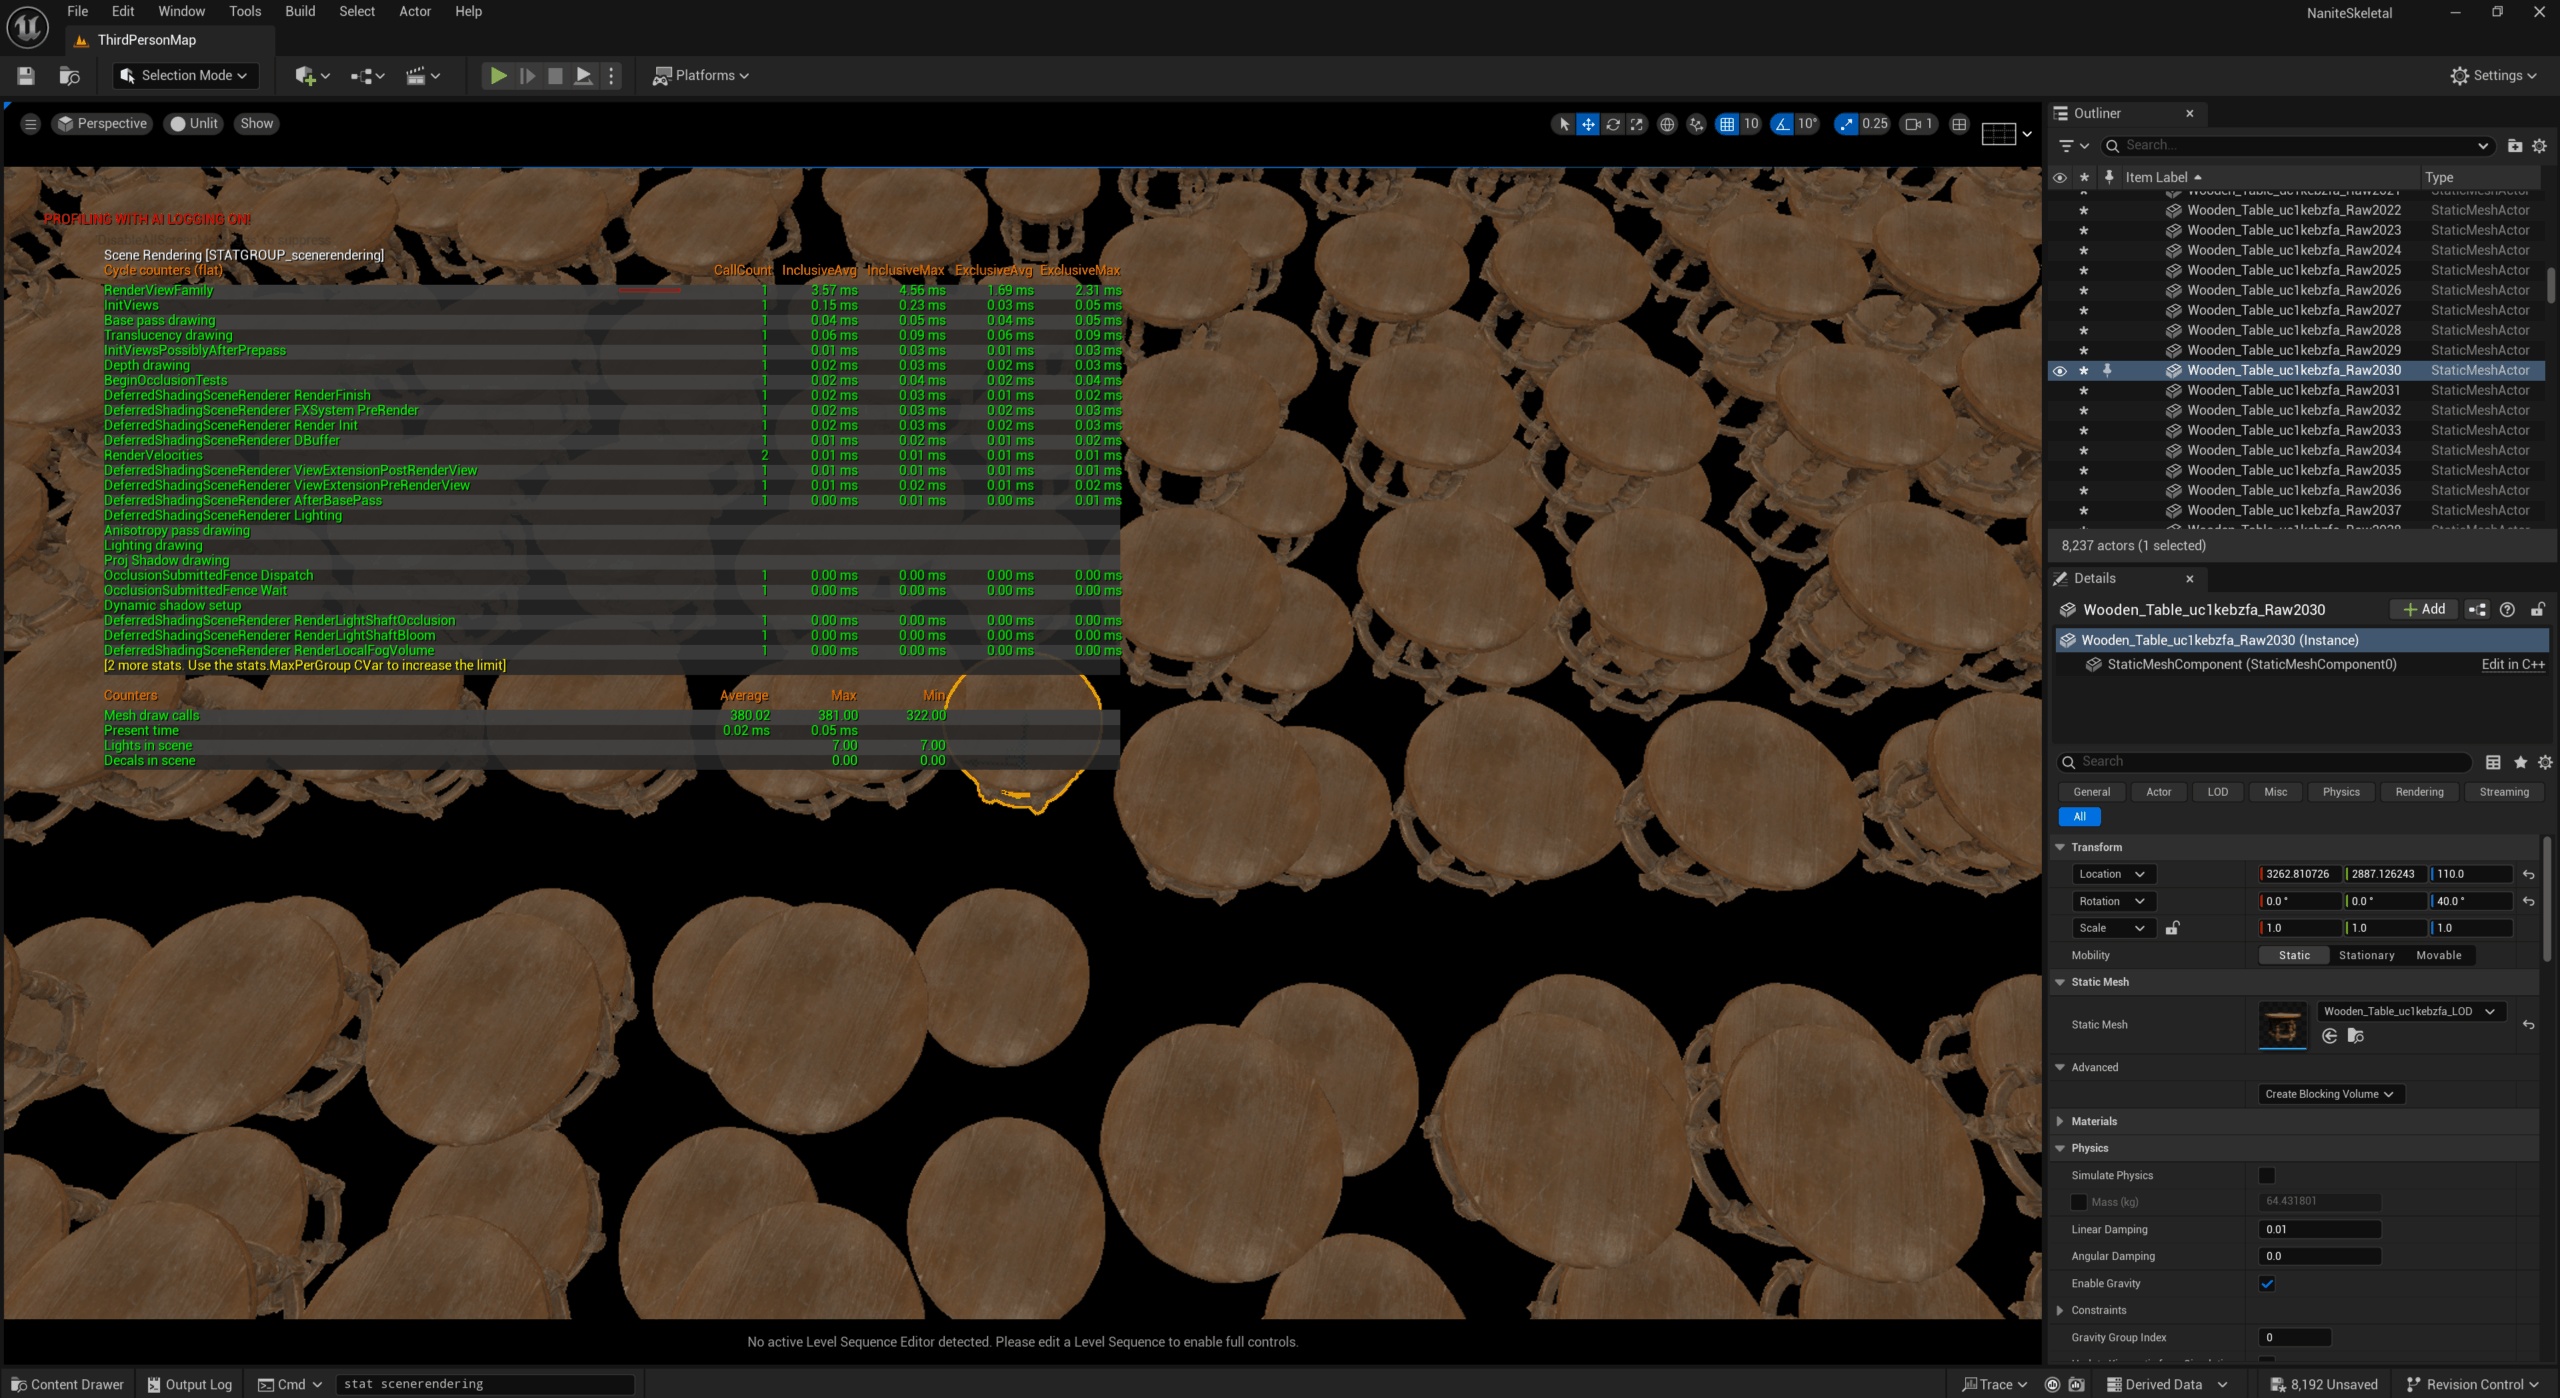 | 380 | 3.57ms |
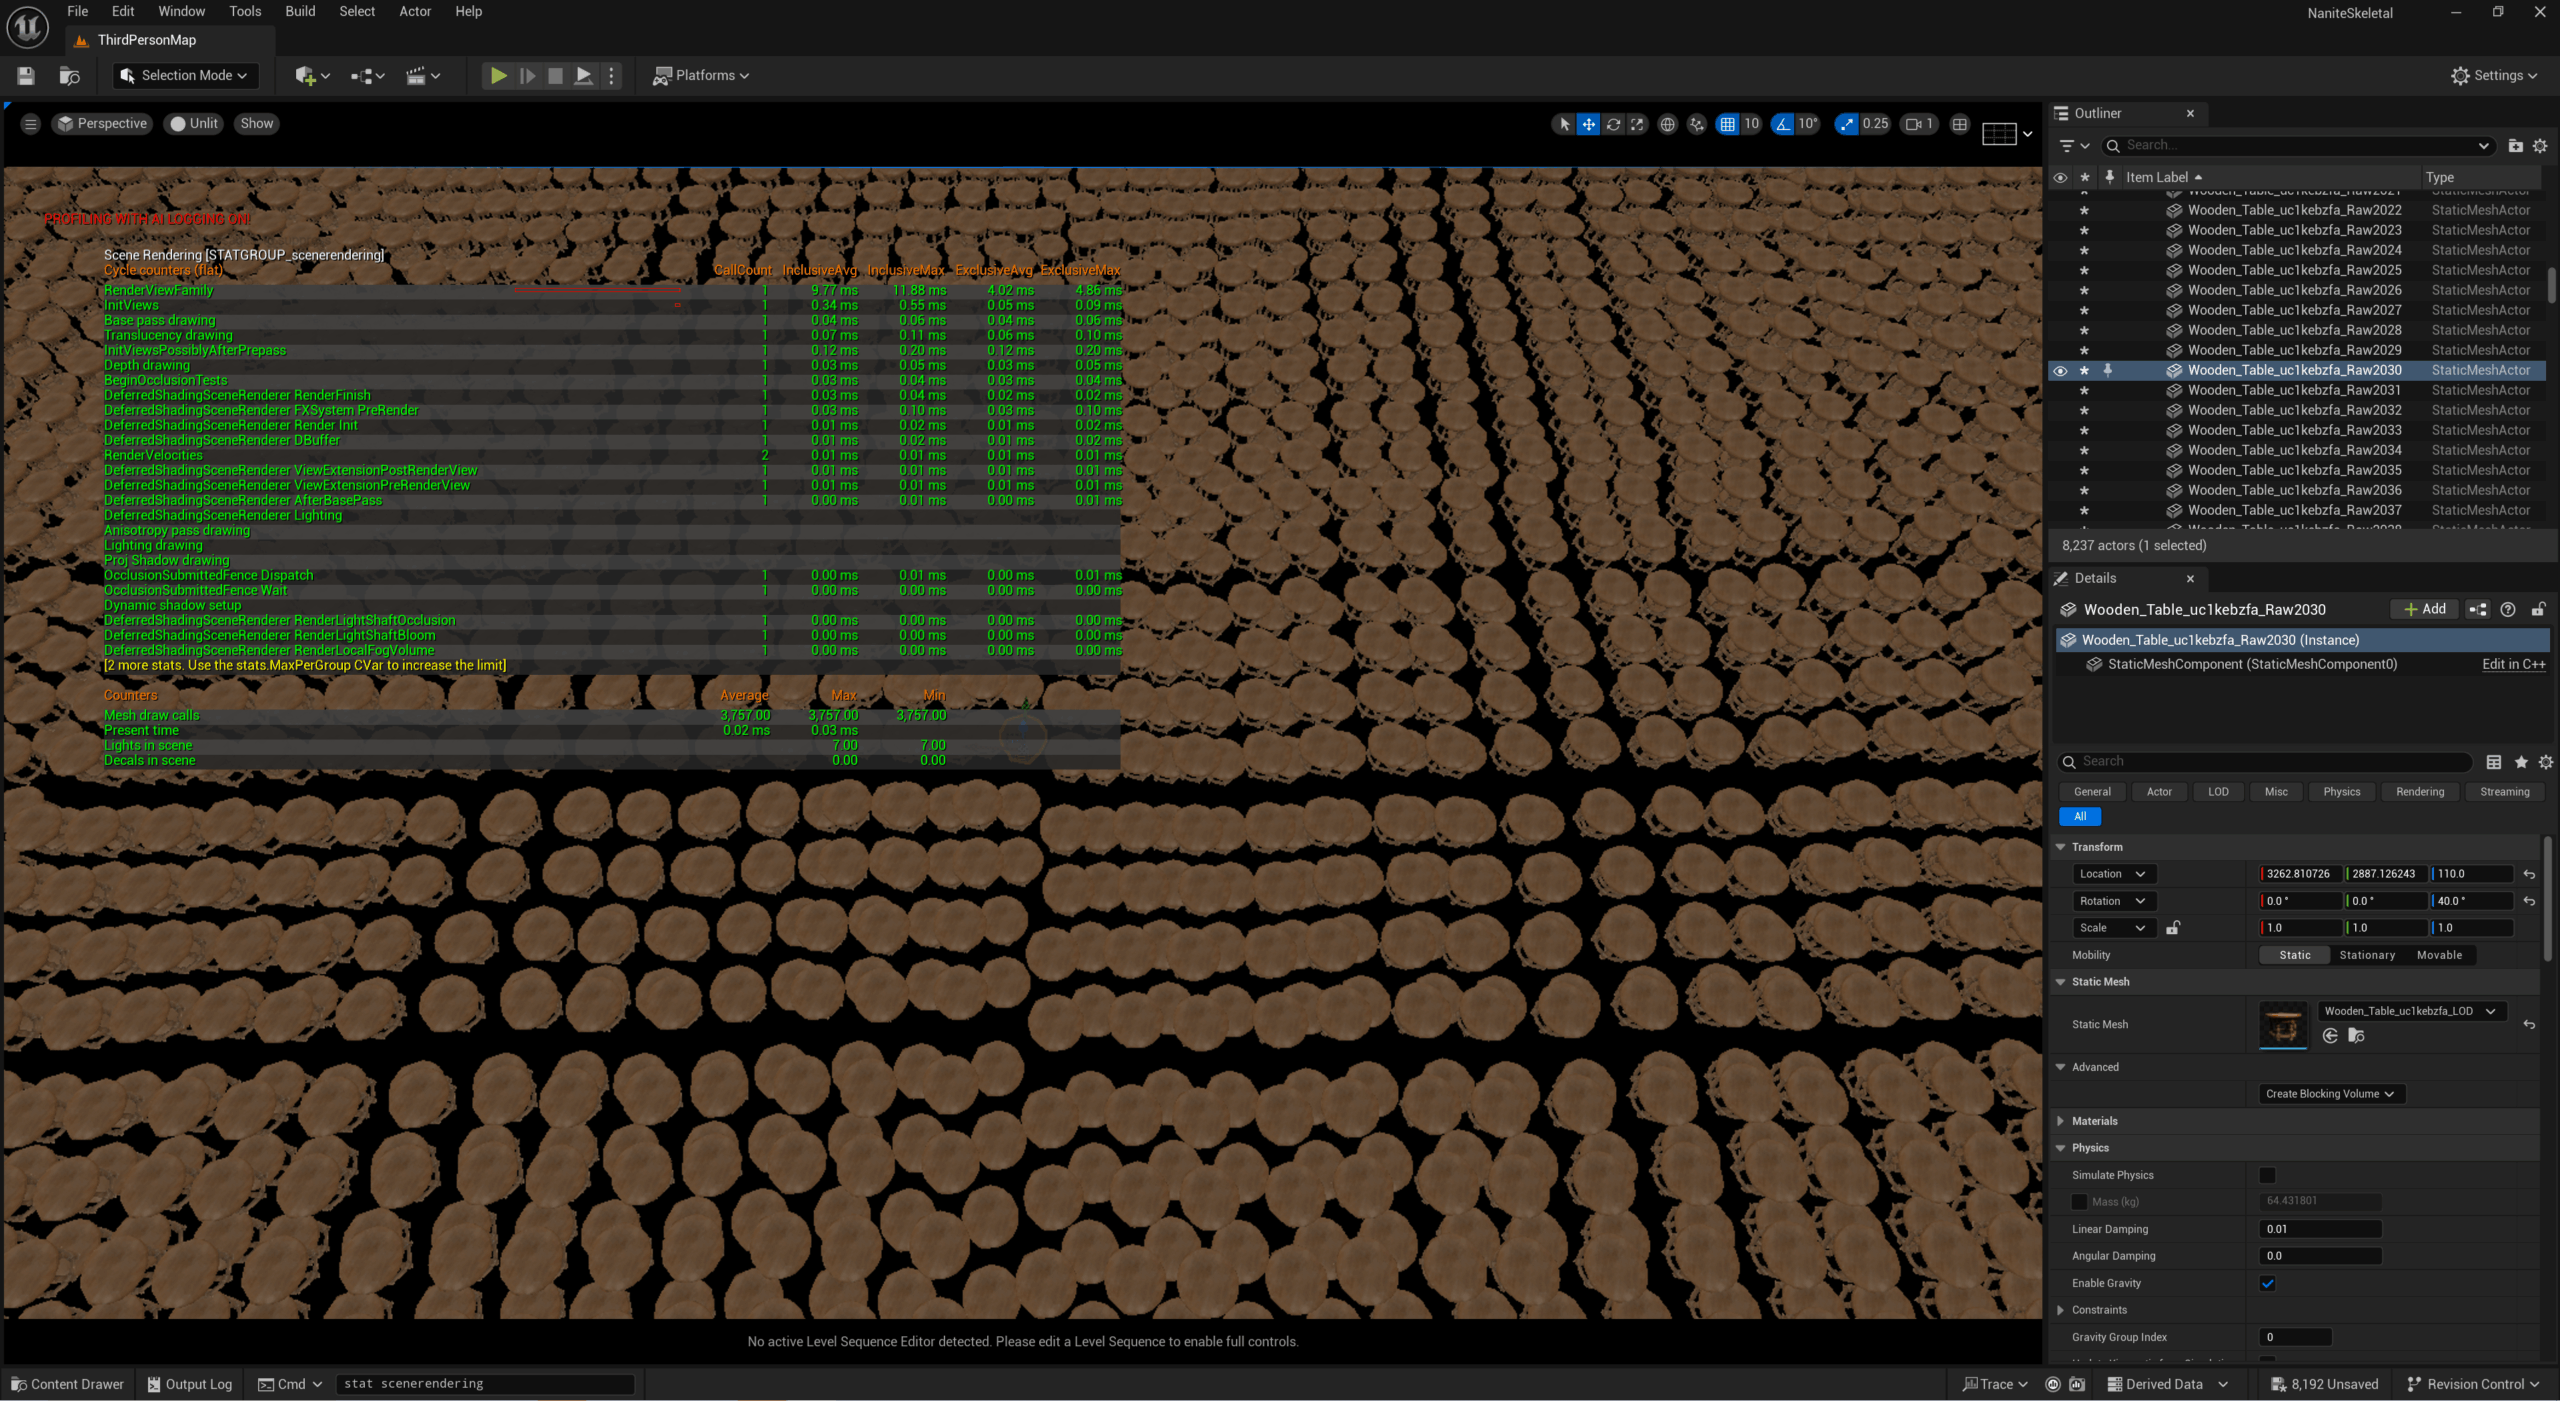 | 3757 | 9.77ms |
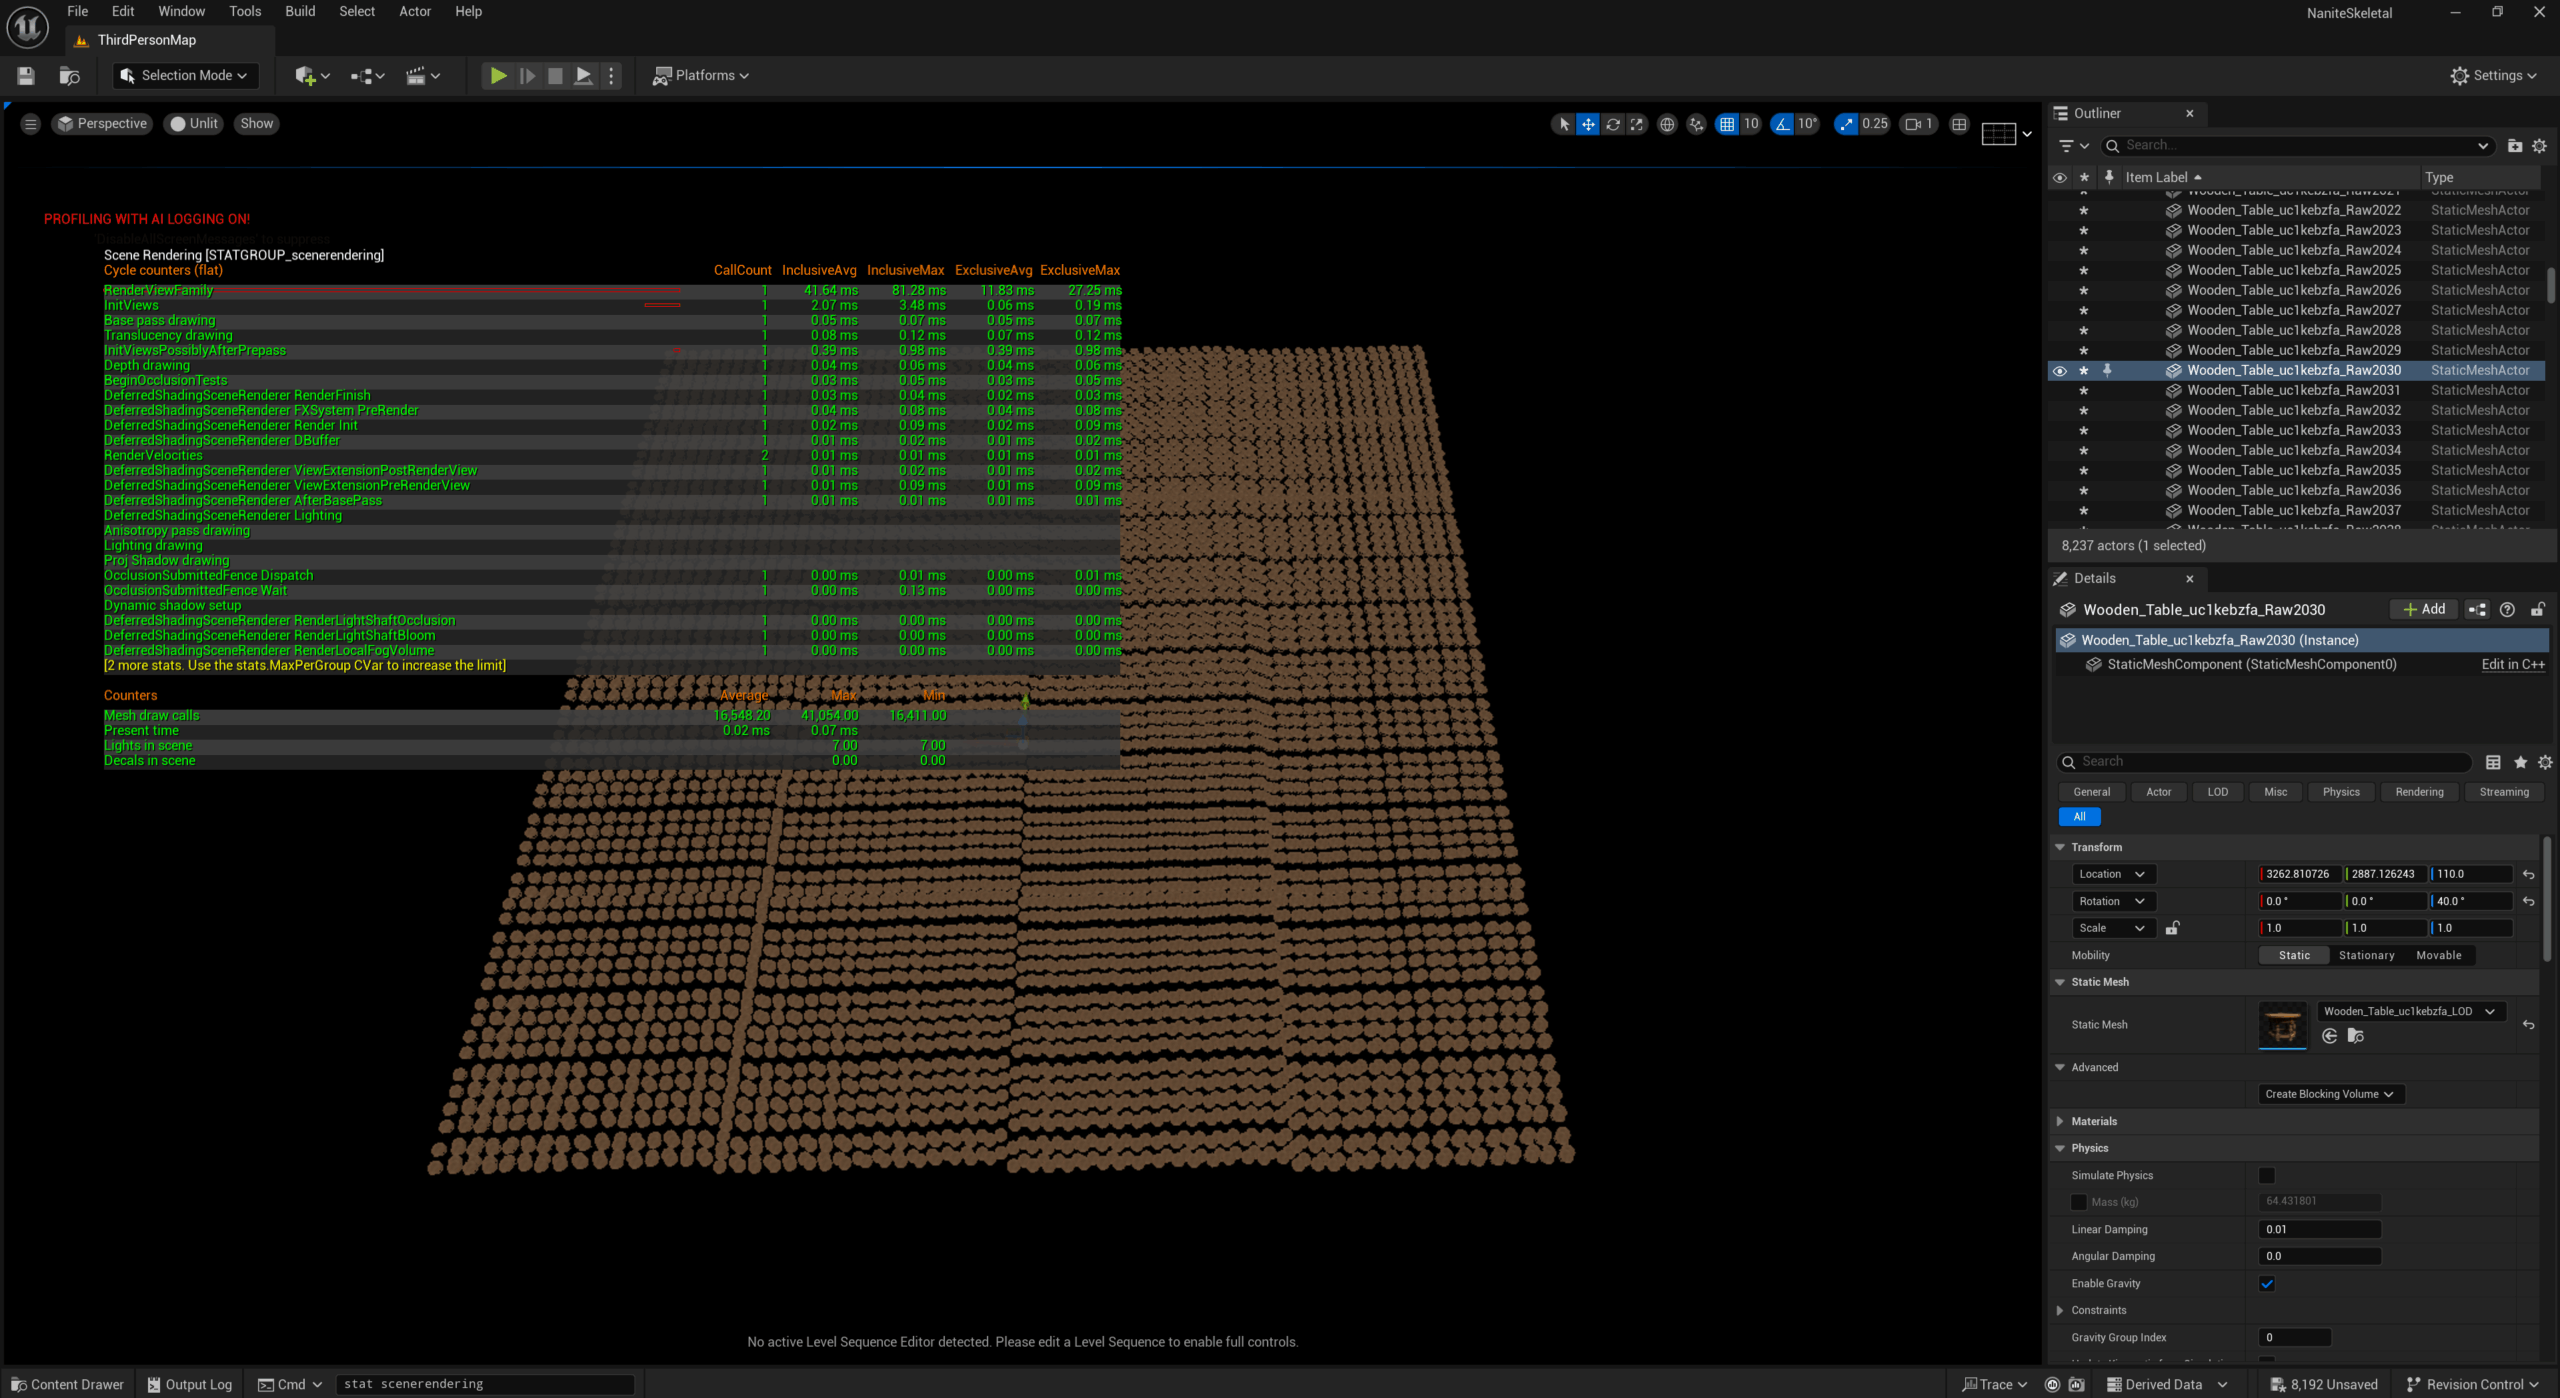 | 1654820 | 41.64ms |
| Nanite | ||
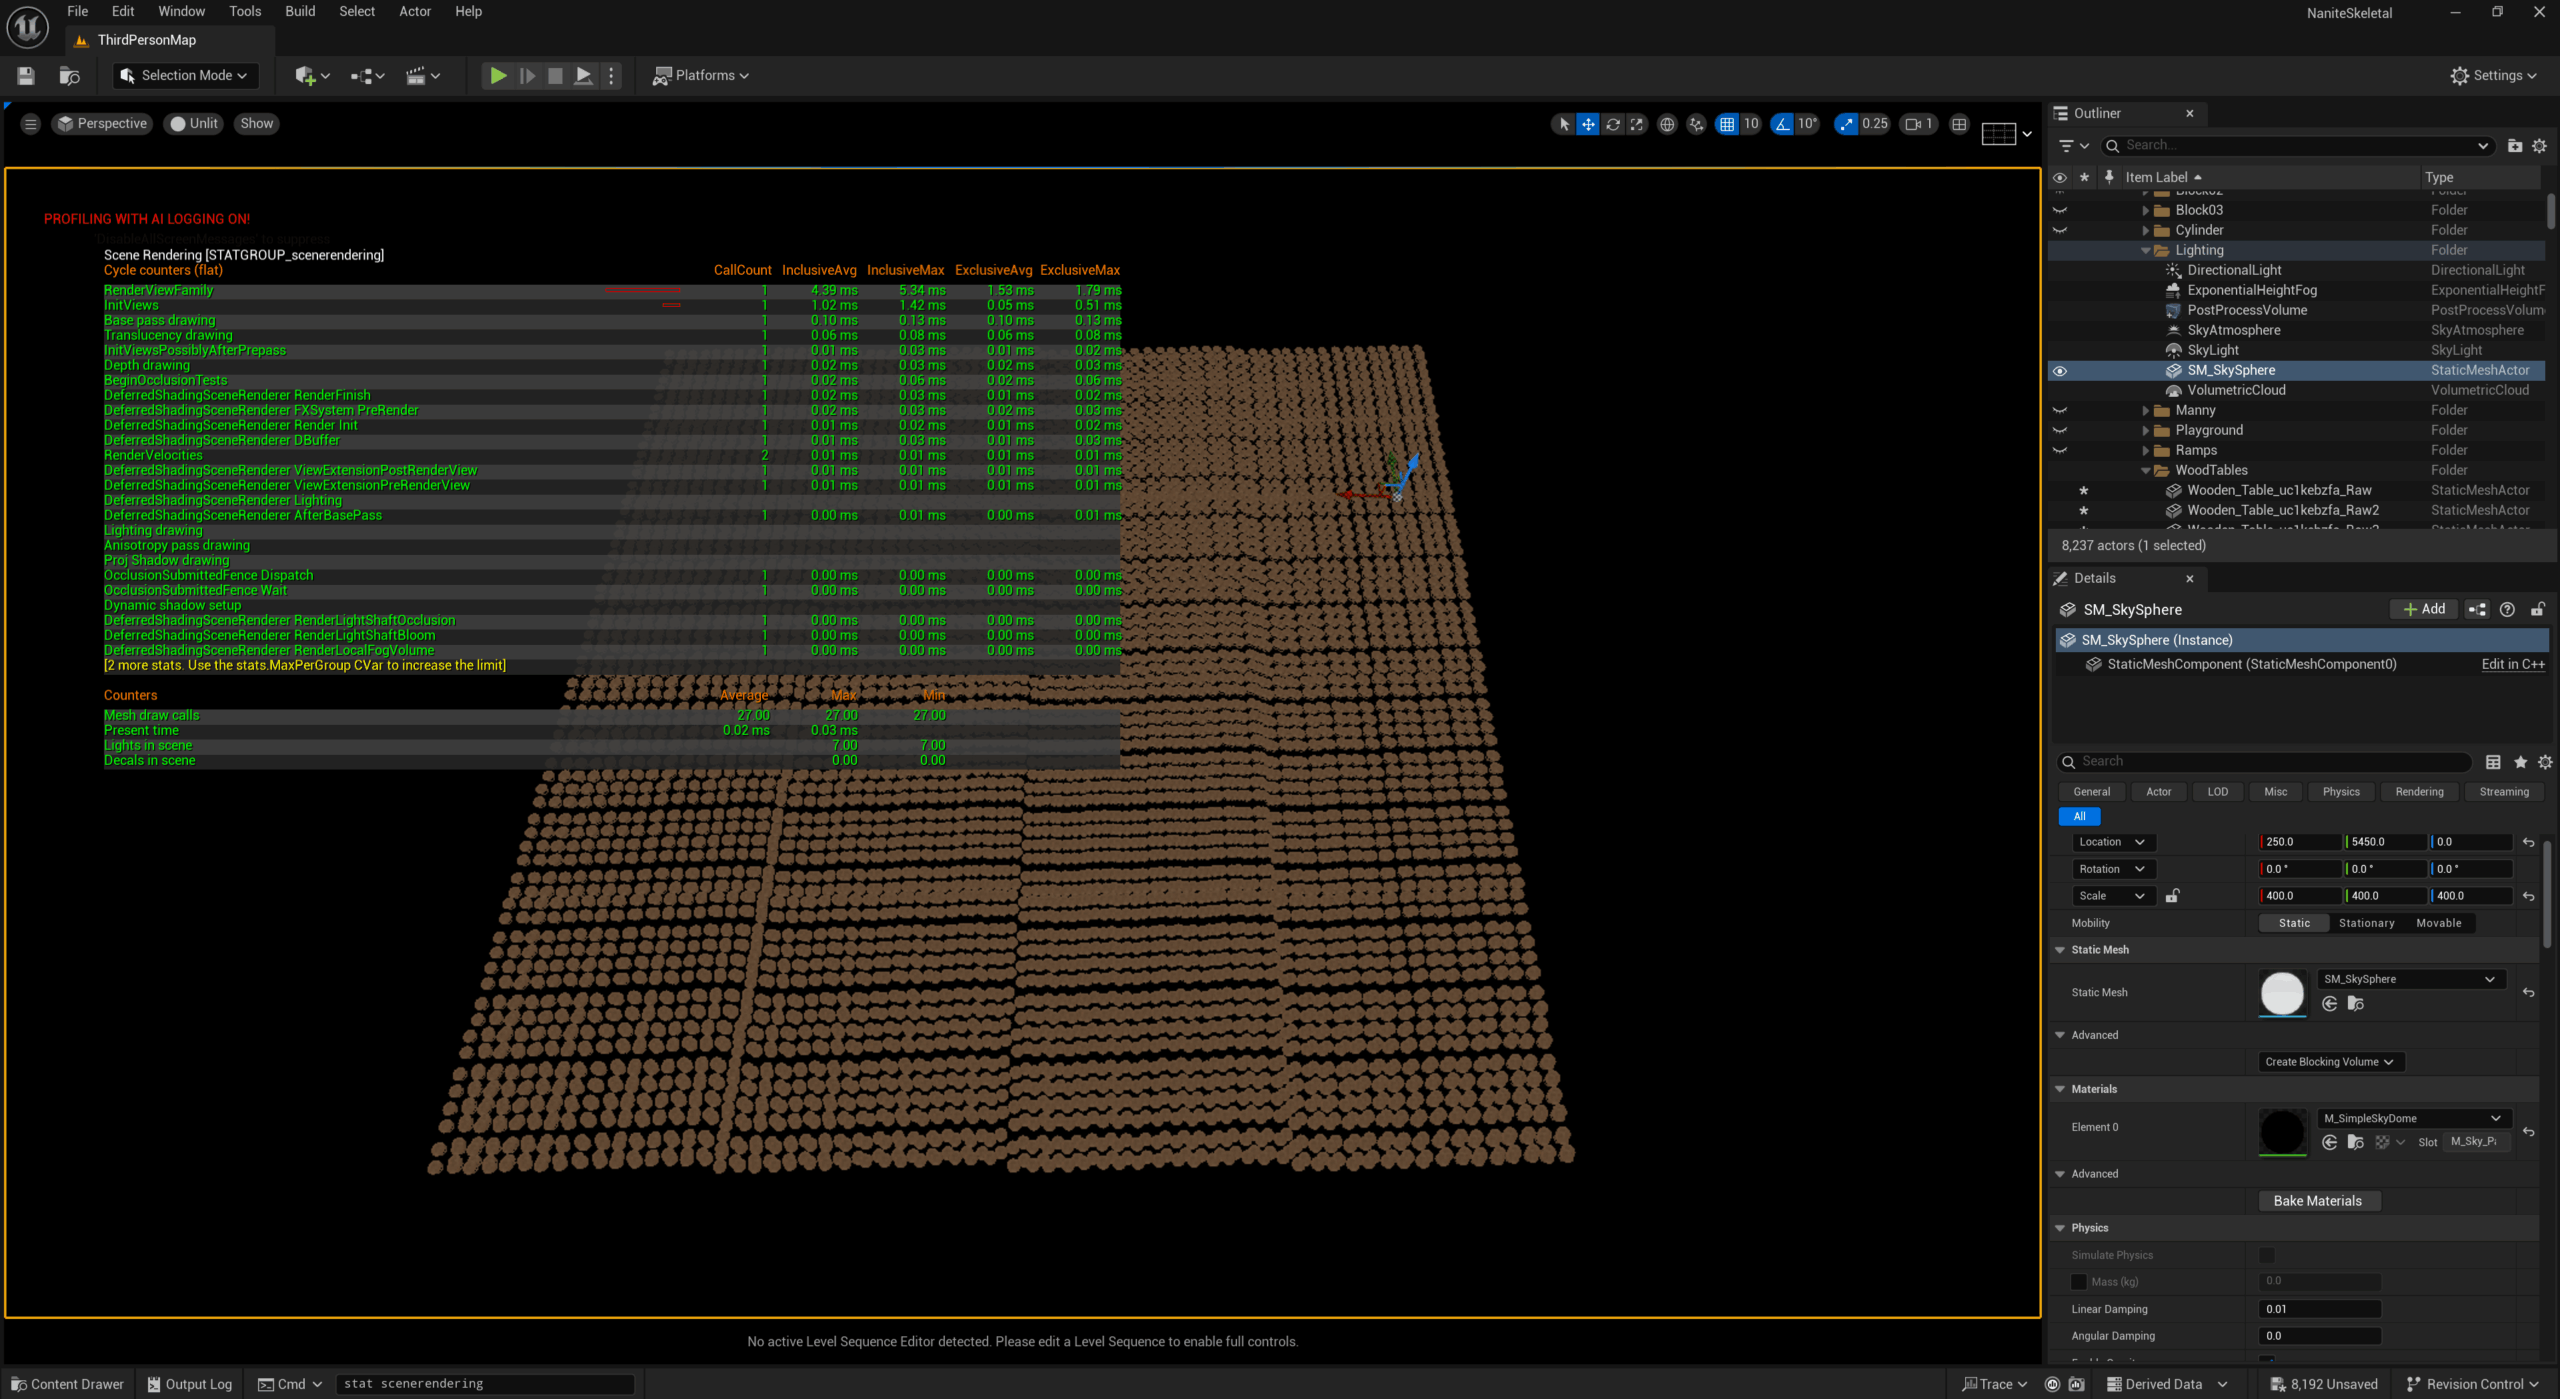 | 27 | 4.39ms |
📝 Note on Test Methodology
This initial round of testing was conducted directly in the Unreal Editor viewport to quickly visualize performance trends. While results reflect valid engine behaviour for asset-heavy scenes, certain features (like GPU culling precision and actor visibility checks) may behave differently in actual gameplay.
A follow-up benchmark using Play-in-Editor (PIE) or Standalone builds is recommended for fully accurate runtime profiling